SCOM 2019 - Port Monitoring (interface utilization)

GA Václav Jandek 191 Reputation points
2021-03-30T09:41:14.78+00:00

Hello Gents,

I've came across following issue.

I need to monitor utilization on certaion ports on network device (discover through SNMP).

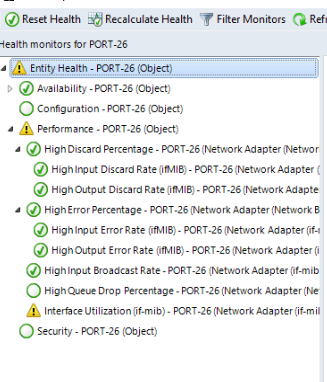
After device has been discovered, by default port 26 had heatlh status as green. In health explorer I could see that there is monitor for Interface Utilization. So I enabled it and everything worked fine.

After that, I discovered another network device (same model of cisco switch, also discovered through SNMP).

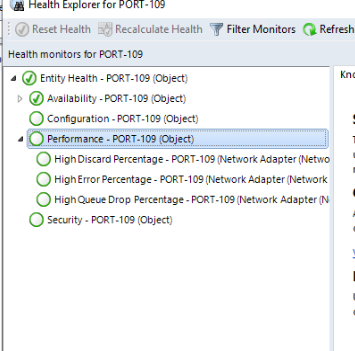
I need to monitor port 109. So I enable port monitoring and went to health status and found out that Interface utilization is completely missing.

Port 26

82744-image.png

port 109 on different device, but exactly same model.

![82751-image.png]3

Any idea why I can't see interface utilization in health explorer?

Thank you,
Vaclav

System Center Operations Manager
A family of System Center products that provide infrastructure monitoring, help ensure the predictable performance and availability of vital applications, and offer comprehensive monitoring for datacenters and cloud, both private and public.
1,603 questions
0 comments No comments
{count} votes

Accepted answer
  1. GA Václav Jandek 191 Reputation points
    2021-04-07T07:32:06.863+00:00

    Hi,

    For some reason there was second port 109 which had interface utilization monitor available.

    So issue resolved.
    Thank you


1 additional answer

Sort by: Most helpful
  1. Crystal-MSFT 53,981 Reputation points Microsoft External Staff
    2021-03-31T02:19:10.81+00:00

    @GA Václav Jandek ,From your description, I know we enable port monitoring on port 109. But the HighDiscardPercentage,HignErrorPercentage,HighQueueDropPercentage are not monitored. In the picture, we find only the Availability is monitored.

    Based on my research, "High Discard Percentage" "High Error Percentage" and "High Queue Drop Percentage" are disabled by default. Could you click HighDiscardPercentageconfirm,HignErrorPercentage,HighQueueDropPercentage which are not monitored and chick Properties to see what are the monitors are and then check if they are enabled on our affected device. If not, try to enable it and see if it is working.
    https://learn.microsoft.com/en-us/system-center/scom/manage-monitor-networkdevice-configure-monitoring?view=sc-om-2019#tuning-alerts-for-network-monitoring

    Please try the above suggestions and if there's any update, feel free to let us know.


    If the response is helpful, please click "Accept Answer" and upvote it.
    Note: Please follow the steps in our documentation to enable e-mail notifications if you want to receive the related email notification for this thread.


Your answer

Answers can be marked as Accepted Answers by the question author, which helps users to know the answer solved the author's problem.