Community Center | Not monitored
Tag not monitored by Microsoft.
This browser is no longer supported.
Upgrade to Microsoft Edge to take advantage of the latest features, security updates, and technical support.
' cx='32' cy='32' r='32' /%3E%3Ctext x='50%25' y='55%25' dominant-baseline='middle' text-anchor='middle' fill='%23FFF' %3ETJ%3C/text%3E%3C/svg%3E)
Hi everyone,
I recently have encountered some problems. In order to explain my problem conveniently, I created a demo case. The structure of this table is similar to the structure of my work. Below is a screenshot of this table and the results I have achieved.
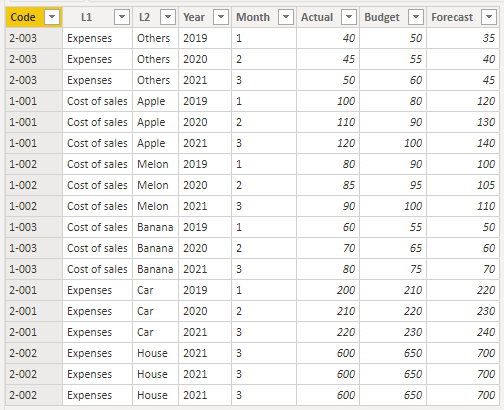
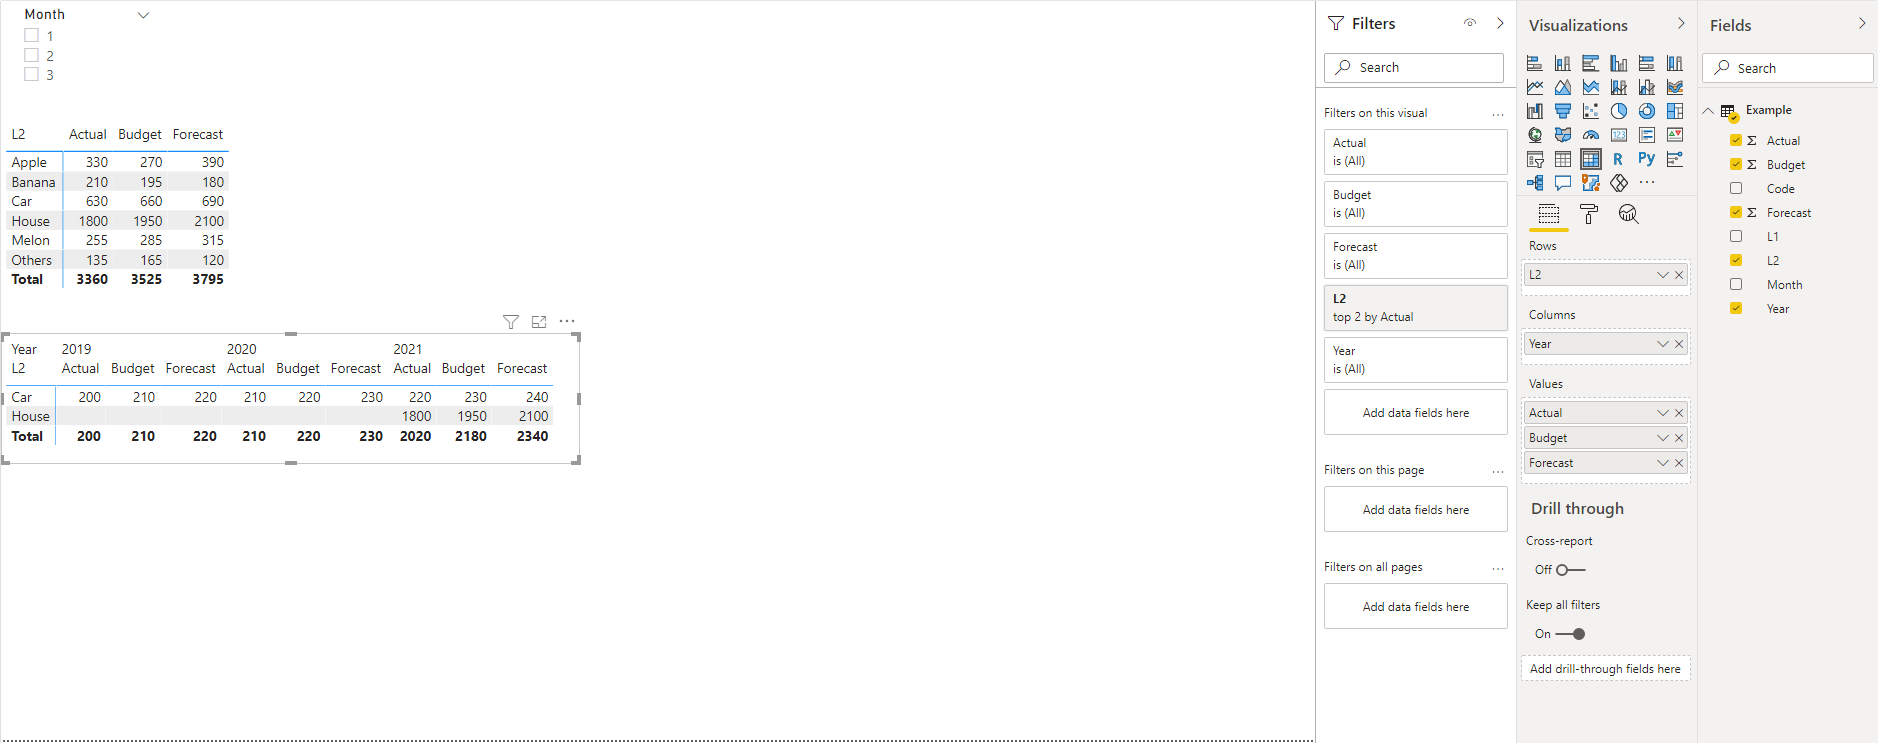
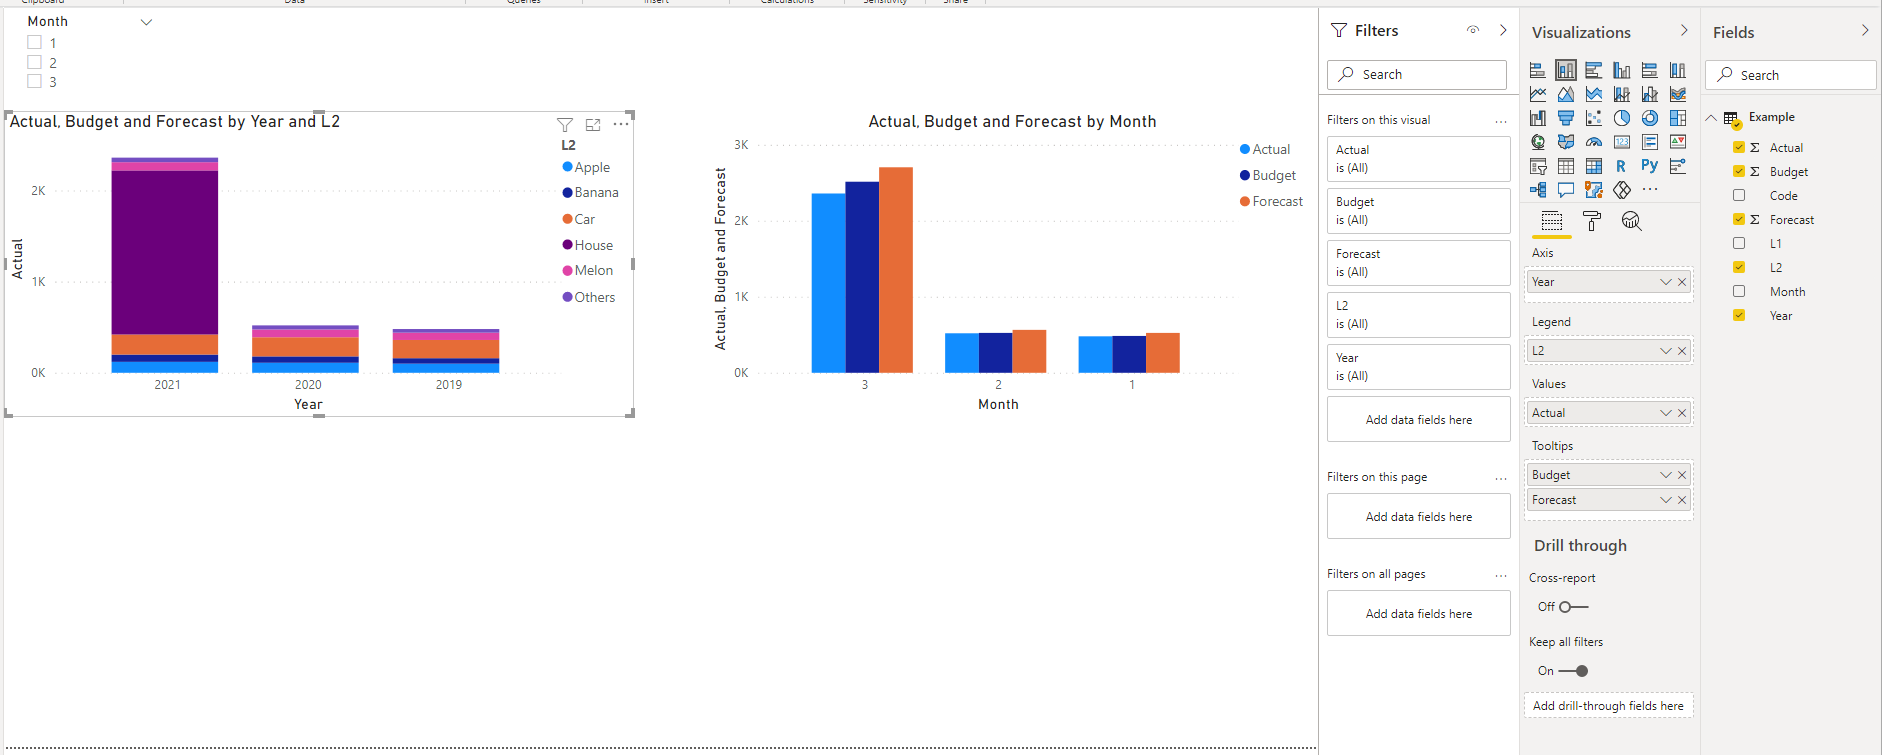
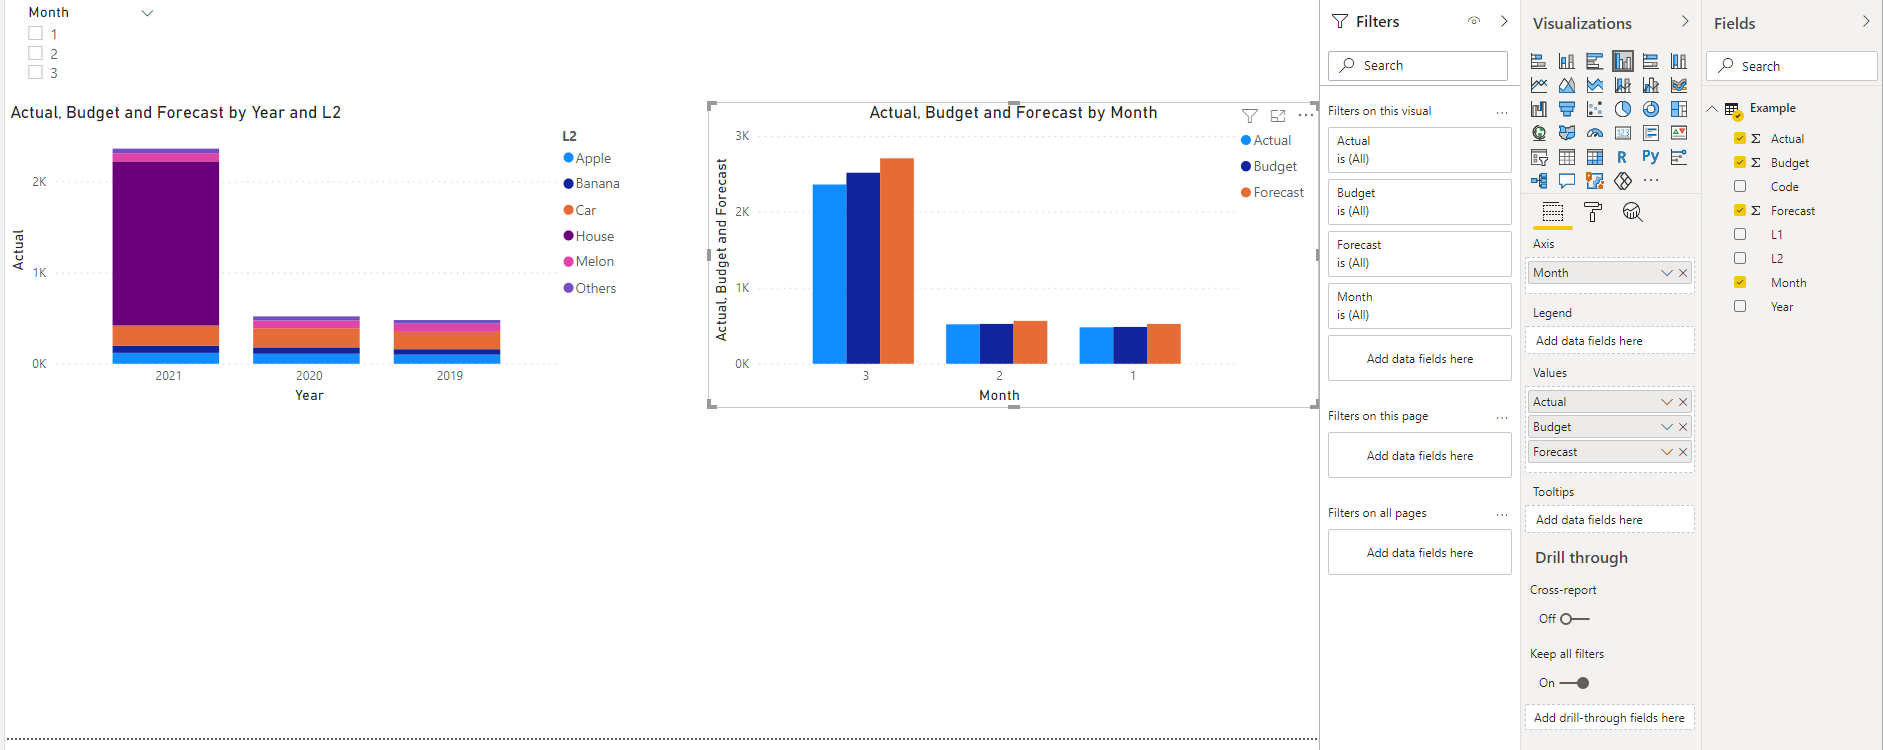
As you can see, the table and two-column charts in the screenshot can be achieved now, but the result I really want to achieve is the following two pictures.
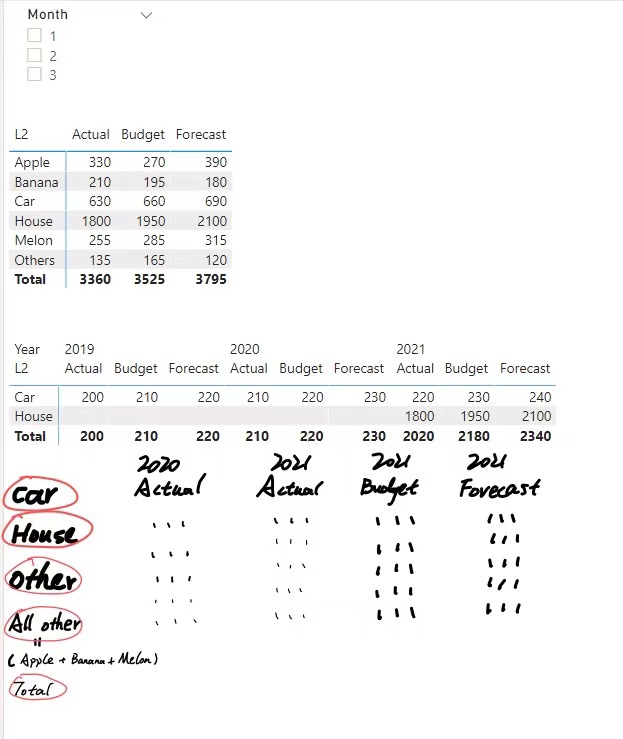
In the final table, I want my row to have the Top-2 values of Actual rank among all L2 values (Car and House in this case), and then separate Others as a row, and then create a new row All Other including all values except Top-2 and Others. (In this case, there are Apple, Banana, and Melon)
In the column, I want to show only 4 columns which are Actual 2020(The Actual value in 2020), Actual 2021, Budget 2021, and Forecast 2021.
The two requirements are too hard for me, I tried a lot of functions such as creating a new table, or add some Measures, but I failed. :(
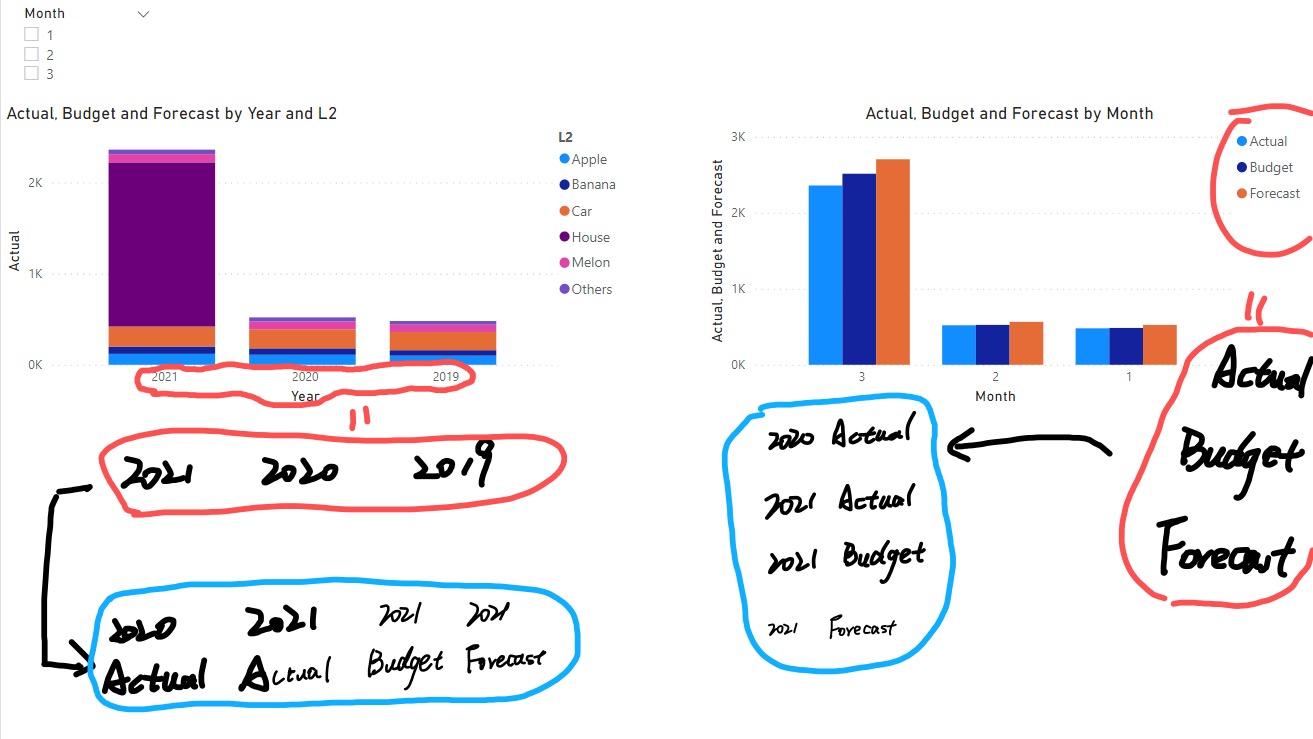
In the two-column charts, I want to show the special value in Axis and Legend (I wrote them in the picture) but I also failed. I don't know which way is the correct one.
' cx='32' cy='32' r='32' /%3E%3Ctext x='50%25' y='55%25' dominant-baseline='middle' text-anchor='middle' fill='%23FFF' %3EEM%3C/text%3E%3C/svg%3E)
This sounds like more of a Power BI question than a Power Query one. I'd recommend you post it on the Power BI Community forum.