Not Monitored
Tag not monitored by Microsoft.
36,665 questions
This browser is no longer supported.
Upgrade to Microsoft Edge to take advantage of the latest features, security updates, and technical support.
' cx='32' cy='32' r='32' /%3E%3Ctext x='50%25' y='55%25' dominant-baseline='middle' text-anchor='middle' fill='%23FFF' %3EAS%3C/text%3E%3C/svg%3E)
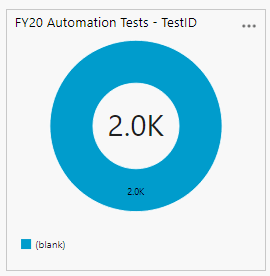
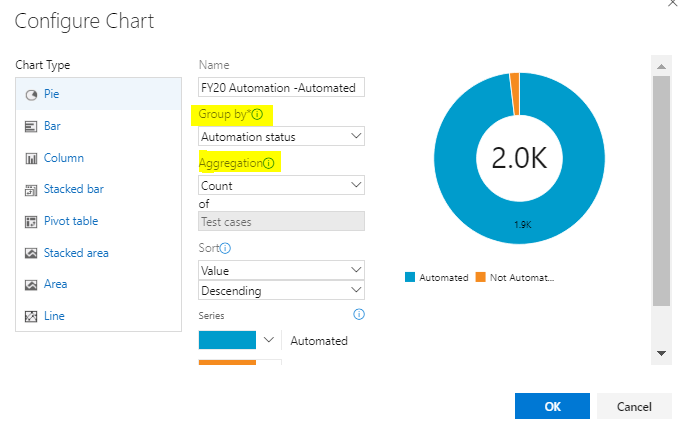
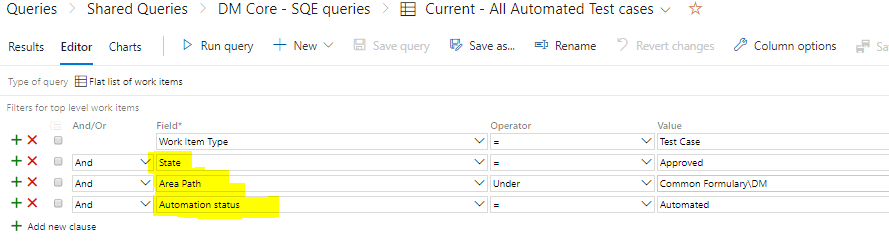
When we create charts under Test Plan the count of the Test Cases is showing incorrectly in Azure Charts. I am expecting the count to be around 1000 but it is showing the count more than 2000.
 ]
]
Few Question:
Kindly suggest what can be done to rectify or understand the behavior of charts in detail.

Hello @Ajay Sharma
Thanks for reaching out. Your query is more inclined towards Azure DevOps and we have a dedicated forum to help you with any technical inquiries/troubleshooting issues. To connect with the right experts, please post your question at - https://developercommunity.visualstudio.com/spaces/21/index.html
------------------------------------------------------------------------------------------------------------------------------
Please do not forget to "Accept the answer" wherever the information provided helps you to help others in the community.
@SadiqhAhmed-MSFT Thank You I will post my query in link you provided.