Developer technologies | Windows Presentation Foundation
A part of the .NET Framework that provides a unified programming model for building line-of-business desktop applications on Windows.
This browser is no longer supported.
Upgrade to Microsoft Edge to take advantage of the latest features, security updates, and technical support.
' cx='32' cy='32' r='32' /%3E%3Ctext x='50%25' y='55%25' dominant-baseline='middle' text-anchor='middle' fill='%23FFF' %3EI5%3C/text%3E%3C/svg%3E)
In a Visual Studio 2019 C# WPF (.NET) project I like to add a line chart to visualise the measurement data of an amplifier as function of frequency.
In this project I am controlling a frequency generator, making a frequency sweep (X-Axis).
The voltage of the generator is the input of an amplifier under test.
The outputvoltage of the amplifier is measured (Y-axis) as function of the frequency.
I have meanwhile seen a lot of different codes on a lot of sites on the internet how to create a chart and come to the conlusion that there is missing some manual
which is describing exactly how you have to write the code to create a simple chart, explaining the properties of the chart and how to write their codes .
I like to find a website which describes these code and how to type them.
I found a Microsoft website how to create a basic chart step by step using the propertypanel. But I like to know the underlying code.
For example how do I find that to change the background color of the chart should be like Chartareas[0].Backcolor=Color.Blue;
or ChartAreas[0].AxisY.Enabled = AxisEnabled.True; and how do I have to write the code to get the measurement data (e.g. the frequency array and the outputvoltage array) in the chart?
I hope you may help me a bit further.
I apologize. You have 'opened my eyes'.
I will look up a forum that better fits my questions.
' cx='32' cy='32' r='32' /%3E%3Ctext x='50%25' y='55%25' dominant-baseline='middle' text-anchor='middle' fill='%23FFF' %3ELG%3C/text%3E%3C/svg%3E)
@DaisyTian-1203 -> You rock. Thank you!

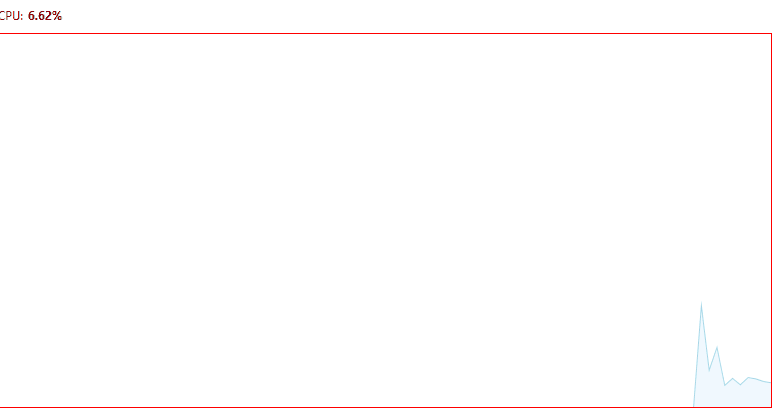
I will show you a line chart with tracking cpu usage for you to refer.
Xaml code:
 <Window.DataContext>
        <local:MainViewModel/>
    </Window.DataContext>
    <Window.Resources>
        <local:PolygonConverter x:Key="PolygonConverter"/>
    </Window.Resources>
    <Grid>
        <Grid.RowDefinitions>
            <RowDefinition Height="Auto"/>
            <RowDefinition/>
        </Grid.RowDefinitions>
        <WrapPanel>
            <TextBlock Margin="5" Text="CPU:"/>
            <TextBlock Margin="0, 5" Text="{Binding LastCpuValue, StringFormat=##0.##}" FontWeight="Bold"/>
            <TextBlock Margin="0, 5" Text="%" FontWeight="Bold"/>
        </WrapPanel>
        <Border Margin="5" Grid.Row="1" BorderThickness="1" BorderBrush="Red" SnapsToDevicePixels="True">
            <Canvas ClipToBounds="True">
                <Polygon Stroke="LightBlue" Fill="AliceBlue">
                    <Polygon.Resources>
                        <Style TargetType="Polygon">
                            <Setter Property="Points">
                                <Setter.Value>
                                    <MultiBinding Converter="{StaticResource PolygonConverter}">
                                        <Binding Path="ProcessorTime.Values"/>
                                        <Binding Path="ActualWidth" RelativeSource="{RelativeSource AncestorType=Canvas}"/>
                                        <Binding Path="ActualHeight" RelativeSource="{RelativeSource AncestorType=Canvas}"/>
                                    </MultiBinding>
                                </Setter.Value>
                            </Setter>
                        </Style>
                    </Polygon.Resources>
                </Polygon>
            </Canvas>
        </Border>
    </Grid>
C# code:
 public class MainViewModel : NotifyPropertyChanged
    {
        public RoundRobinCollection ProcessorTime { get; }
        private float _lastCpuValue;
        public float LastCpuValue
        {
            get => _lastCpuValue;
            set
            {
                _lastCpuValue = value;
                OnPropertyChanged(nameof(LastCpuValue));
            }
        }

        private async void ReadCpu()
        {
            try
            {
                using (PerformanceCounter cpuCounter = new PerformanceCounter("Processor", "% Processor Time", "_Total"))
                {
                    while (true)
                    {
                        LastCpuValue = cpuCounter.NextValue();
                        ProcessorTime.Push(LastCpuValue);
                        await Task.Delay(1000);
                    }
                }
            }
            catch (Exception ex)
            {
                Debug.WriteLine(ex.Message);
            }
        }

        public MainViewModel()
        {
            ProcessorTime = new RoundRobinCollection(100);
            ReadCpu();
        }
    }


    public class RoundRobinCollection : NotifyPropertyChanged
    {
        private readonly List<float> _values;
        public IReadOnlyList<float> Values => _values;

        public RoundRobinCollection(int amount)
        {
            _values = new List<float>();
            for (int i = 0; i < amount; i++)
                _values.Add(0F);
        }

        public void Push(float value)
        {
            _values.RemoveAt(0);
            _values.Add(value);
            OnPropertyChanged(nameof(Values));
        }
    }
public class NotifyPropertyChanged : INotifyPropertyChanged
    {
        public event PropertyChangedEventHandler PropertyChanged;
        protected virtual void OnPropertyChanged([CallerMemberName] string propertyName = null)
            => PropertyChanged?.Invoke(this, new PropertyChangedEventArgs(propertyName));
    }
 public class PolygonConverter : IMultiValueConverter
    {
        public object Convert(object[] values, Type targetType, object parameter, CultureInfo culture)
        {
            PointCollection points = new PointCollection();
            if (values.Length == 3 && values[0] is IReadOnlyList<float> dataPoints && values[1] is double width && values[2] is double height)
            {
                points.Add(new Point(0, height));
                points.Add(new Point(width, height));
                double step = width / (dataPoints.Count - 1);
                double position = width;
                for (int i = dataPoints.Count - 1; i >= 0; i--)
                {
                    points.Add(new Point(position, height - height * dataPoints[i] / 100));
                    position -= step;
                }
            }
            return points;
        }

        public object[] ConvertBack(object value, Type[] targetTypes, object parameter, CultureInfo culture) => null;
    }
The result picture :
Did my answer give you any help? If it doesn't, could you show me the link of your Microsoft website how to create a basic chart step by step using the propertypanel for me to analyze ?
If the response is helpful, please click "Accept Answer" and upvote it.
Note: Please follow the steps in our documentation to enable e-mail notifications if you want to receive the related email notification for this thread.
There are a lot of compiler errors after loading your C# example in Visual Studio Community 2019 .
May be I am missing something to load.
Please can you specify which template I have to select ?
And where exactly I have to paste your code.
(also errors using your XAML example after starting up VS19 in XAML mode)
@iloinenharrastus-5532
Did you add below namespaces to MainViewModel, RoundRobinCollection, NotifyPropertyChanged and PolygonConverter?
//MainViewModel and RoundRobinCollection namespaces
using System;
using System.Collections.Generic;
using System.Diagnostics;
using System.Threading.Tasks;

//NotifyPropertyChanged namespaces
using System.Runtime.CompilerServices;
using System.ComponentModel;

//PolygonConverter namespaces
using System;
using System.Collections.Generic;
using System.Globalization;
using System.Windows;
using System.Windows.Data;
using System.Windows.Media;

Hi,
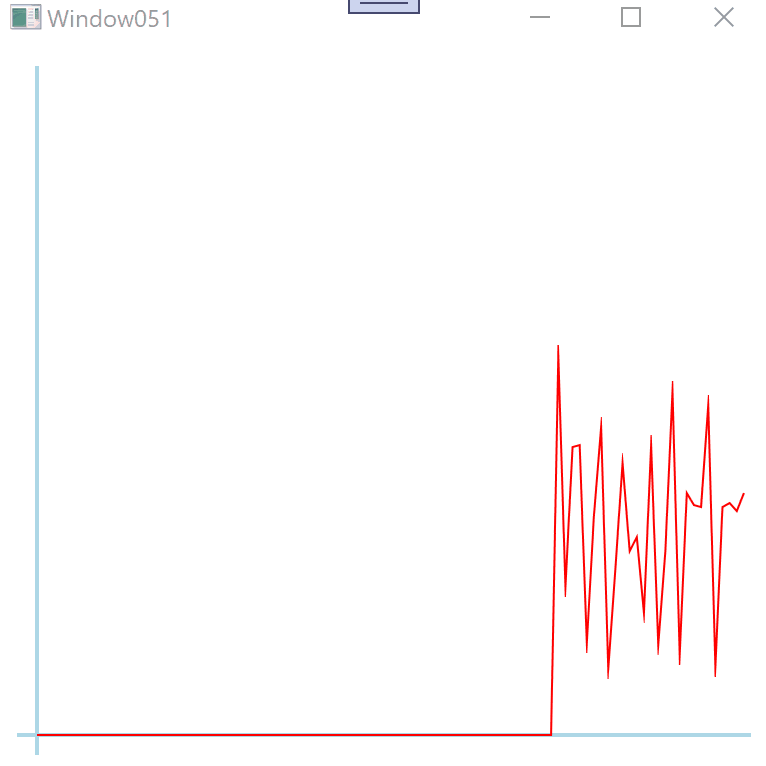
you can write yours own plot element like in following demo:
XAML:
<Window x:Class="WpfApp1.Window051"
        xmlns="http://schemas.microsoft.com/winfx/2006/xaml/presentation"
        xmlns:x="http://schemas.microsoft.com/winfx/2006/xaml"
        xmlns:d="http://schemas.microsoft.com/expression/blend/2008"
        xmlns:mc="http://schemas.openxmlformats.org/markup-compatibility/2006"
        xmlns:local="clr-namespace:WpfApp051"
        xmlns:cc="clr-namespace:WpfApp051"
        mc:Ignorable="d"
        Title="Window051" Height="400" Width="400">
  <Window.DataContext>
    <local:ViewModel/>
  </Window.DataContext>
  <Grid>
    <cc:Plot Margin="10" Data="{Binding Points}"/>
  </Grid>
</Window>
And code:
using System;
using System.ComponentModel;
using System.Runtime.CompilerServices;
using System.Threading.Tasks;
using System.Windows;
using System.Windows.Controls;
using System.Windows.Media;
using System.Windows.Shapes;

namespace WpfApp051
{
  public class ViewModel : INotifyPropertyChanged
  {
    public ViewModel() => GeneratePoints();

    private async void GeneratePoints()
    {
      Random rnd = new Random();
      do
      {
        double[] db = new double[100];
        for (int i = 0; i < Points.GetUpperBound(0); i++) db[i] = Points[i+1];
        db[99] = rnd.Next(20, 200);
        Points = db;
        OnPropertyChanged(nameof(Points));
        await Task.Delay(50);
      } while (true);
    }

    public double[] Points { get; set; } = new double[100];

    public event PropertyChangedEventHandler PropertyChanged;
    private void OnPropertyChanged([CallerMemberName] string propName = "") => PropertyChanged?.Invoke(this, new PropertyChangedEventArgs(propName));
  }

  class Plot : FrameworkElement
  {
    VisualCollection children;
    Canvas plotArea;
    Polyline poly;
    Line xAxis, yAxis;
    Point Origin = new Point(10, 10);
    double[] Points { get; set; } = new double[0];

    public Plot()
    {
      children = new VisualCollection(this);
      initAxis();
      initPlotArea();
    }

    public int XPoints { get; set; } = 100;
    public int YPoints { get; set; } = 100;
    public Brush LineColor { get; set; } = Brushes.Red;

    public static readonly DependencyProperty DataProperty
    = DependencyProperty.RegisterAttached("Data", typeof(double[]), typeof(Plot),
      new FrameworkPropertyMetadata(null,FrameworkPropertyMetadataOptions.AffectsArrange,
        new PropertyChangedCallback(DataChanged)));
    public static double[] GetData(DependencyObject obj) => (double[])obj.GetValue(DataProperty);
    public static void SetData(DependencyObject obj, double[] data) => obj.SetValue(DataProperty, data);

    private static void DataChanged(DependencyObject d, DependencyPropertyChangedEventArgs e)
    {
      var plot = d as Plot;
      if (plot == null) throw new InvalidOperationException("Error using Data property.");
      var data = e.NewValue as double[];
      plot.Points = data;
    }

    void initAxis()
    {
      xAxis = new Line() { Stroke = Brushes.LightBlue, StrokeThickness = 2 };
      yAxis = new Line() { Stroke = Brushes.LightBlue, StrokeThickness = 2 };
      children.Add(xAxis);
      children.Add(yAxis);
    }

    void initPlotArea()
    {
      plotArea = new Canvas()
      {
        LayoutTransform = new ScaleTransform() { ScaleY = -1 },
        RenderTransform = new TransformGroup() { Children = { new ScaleTransform(), new TranslateTransform() } }
      };
      children.Add(plotArea);
      poly = new Polyline() { Stroke = LineColor, StrokeThickness = 1 };
      plotArea.Children.Add(poly);
    }

    void rearrangeAxis(Size size)
    {
      xAxis.X1 = 0;
      xAxis.X2 = size.Width;
      xAxis.Y1 = xAxis.Y2 = size.Height - Origin.Y;
      yAxis.X1 = yAxis.X2 = Origin.X;
      yAxis.Y1 = 0;
      yAxis.Y2 = size.Height;
      xAxis.Measure(size);
      xAxis.Arrange(new Rect(xAxis.DesiredSize));
      yAxis.Measure(size);
      yAxis.Arrange(new Rect(yAxis.DesiredSize));
    }

    void rearrangePlotArea(Size size)
    {
      plotArea.Width = size.Width - Origin.X;
      plotArea.Height = size.Height - Origin.Y;
      var translate = (TranslateTransform)((TransformGroup)plotArea.RenderTransform).Children[1];
      translate.X = Origin.X;
      translate.Y = 0;
      plotArea.Measure(size);
      plotArea.Arrange(new Rect(plotArea.DesiredSize));
      var points = new PointCollection();
      double xStep = plotArea.Width / XPoints;
      double yFactor = plotArea.Height / YPoints;
      for (int i = 0; i < YPoints && i <= Points.GetUpperBound(0); i++)
        points.Add(new Point(i * xStep, Points[i]));
      poly.Points = points;
    }

    protected override Size ArrangeOverride(Size finalSize)
    {
      rearrangeAxis(finalSize);
      rearrangePlotArea(finalSize);
      return finalSize;
    }

    protected override Visual GetVisualChild(int index) => children[index];
    protected override int VisualChildrenCount => children.Count;
  }
}
Result:
I apologize. You have "opened my eyes".
I will look for another forum that better fits my questions.

This article should help
https://www.c-sharpcorner.com/uploadfile/mahesh/line-chart-in-wpf/
Thank you for the link.
Unfortunately the advised wpf toolkit, which is apparently essential to let the Chart demo work, could not be installed (no dll in the package).
Thank you for your message.
It should have been fine if I had found these namespaces in your first message.
Unfortunately "using System.Windows.Data;" and "using System.Windows.Media;"
could not be found by the system.
By searching on the internet I found that I had to add a Reference for these two namespaces.
After adding those there are still errors:
CS0012 The type 'Point' is defined in an assembly that is not referenced. You must add a reference to assembly 'WindowsBase, Version=4.0.0.0, Culture=neutral, PublicKeyToken=31bf3856ad364e35 and
CS0012 The type 'Freezable' is defined in an assembly that is not referenced. You must add a reference to assembly 'WindowsBase, Version=4.0.0.0, Culture=neutral, PublicKeyToken=31bf3856ad364e35
and
CS1503 Argument : cannot convert from 'double' to 'int'
These three errors refer to the lines:
points.Add(new Point(0, height));
points.Add(new Point(width, height));
points.Add(new Point(position, height - height * dataPoints[i] / 100));
Sorry, but your example to explain/show me a simple line chart seems to be too complex for me.
@iloinenharrastus-5532
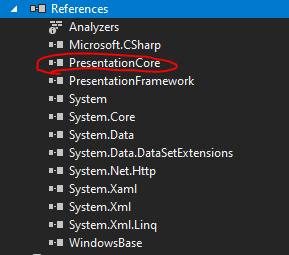
Please add PresentationCore in your project References by searching in Reference Manager.
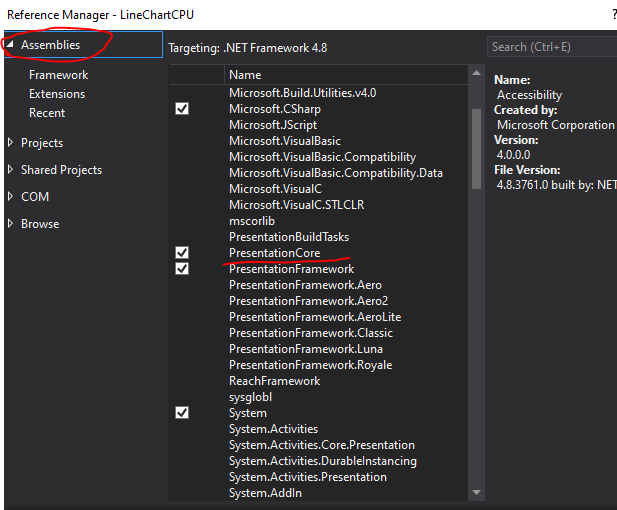
Here is my References for you to refer:
Thank you for your help.
I have tried your last tip. After loading Presentation Core, the number of errors are increasing. Also other type of errors are coming up.
I am confident that your example will work, but unfortunately it doesn't help me further this way.
I like to close this thread and I thank you for your contribution.
@iloinenharrastus-5532
Sorry for giving you little help. Could you show your error for me to analyze?
Also your example gives a lot of errors after loading in VS2019 (also by adding the concerning References w.r.t. using System.Windows.Controls;
using System.Windows.Media; and using System.Windows.Shapes;)
I think it is worth to mention first how you did create your project after selecting Create New Project.
Supposing a chart is created, I then obviously have to startup in C# - Desktop with a template Windows Form App (.NET Framework)
If I delete first the generated 25 lines in the file Form1.cs and then paste your text (132 lines), then 103 errors are generated.
I like to know how I can create (by code in C#) a line chart where I can show the result of the measurement results which are received by the Serial Input Port (in my case).
And I like to write code that the X- axis is getting the Start-frequency as X-min of the Frequency Sweep and the Stop-frequency as X-max.
The vertical axis is initially auto set by the values of the measurement results, but there has to be an option to manually set Y-min and Y-max, derived from textboxes
to zoom in to the measurement data.
I like to find a document about Chart Control explaining how one can write code in C# to get the desired line chart . And visualised how the Line Chart look like.
One can set a lot of properties of a chart, but it seems also to be possible to write it in code.
So in my case the program knows the start- and stop frequency values of the frequency sweep and assigns these values to X-min and X-max.
The Y-min and Y max values are found by calculating the min- and max values of the incoming data from the Serial Input Port.
So it is needed to initally write some lines of code to setup a Line Chart and then after the measurement the curve is drawn.
That is what I'm looking for.
Hi,
you posted in Windows WPF Q&A and write that you use template Windows Form App (.NET Framework). That are different technologies.