Azure Monitor
An Azure service that is used to collect, analyze, and act on telemetry data from Azure and on-premises environments.
3,661 questions
This browser is no longer supported.
Upgrade to Microsoft Edge to take advantage of the latest features, security updates, and technical support.

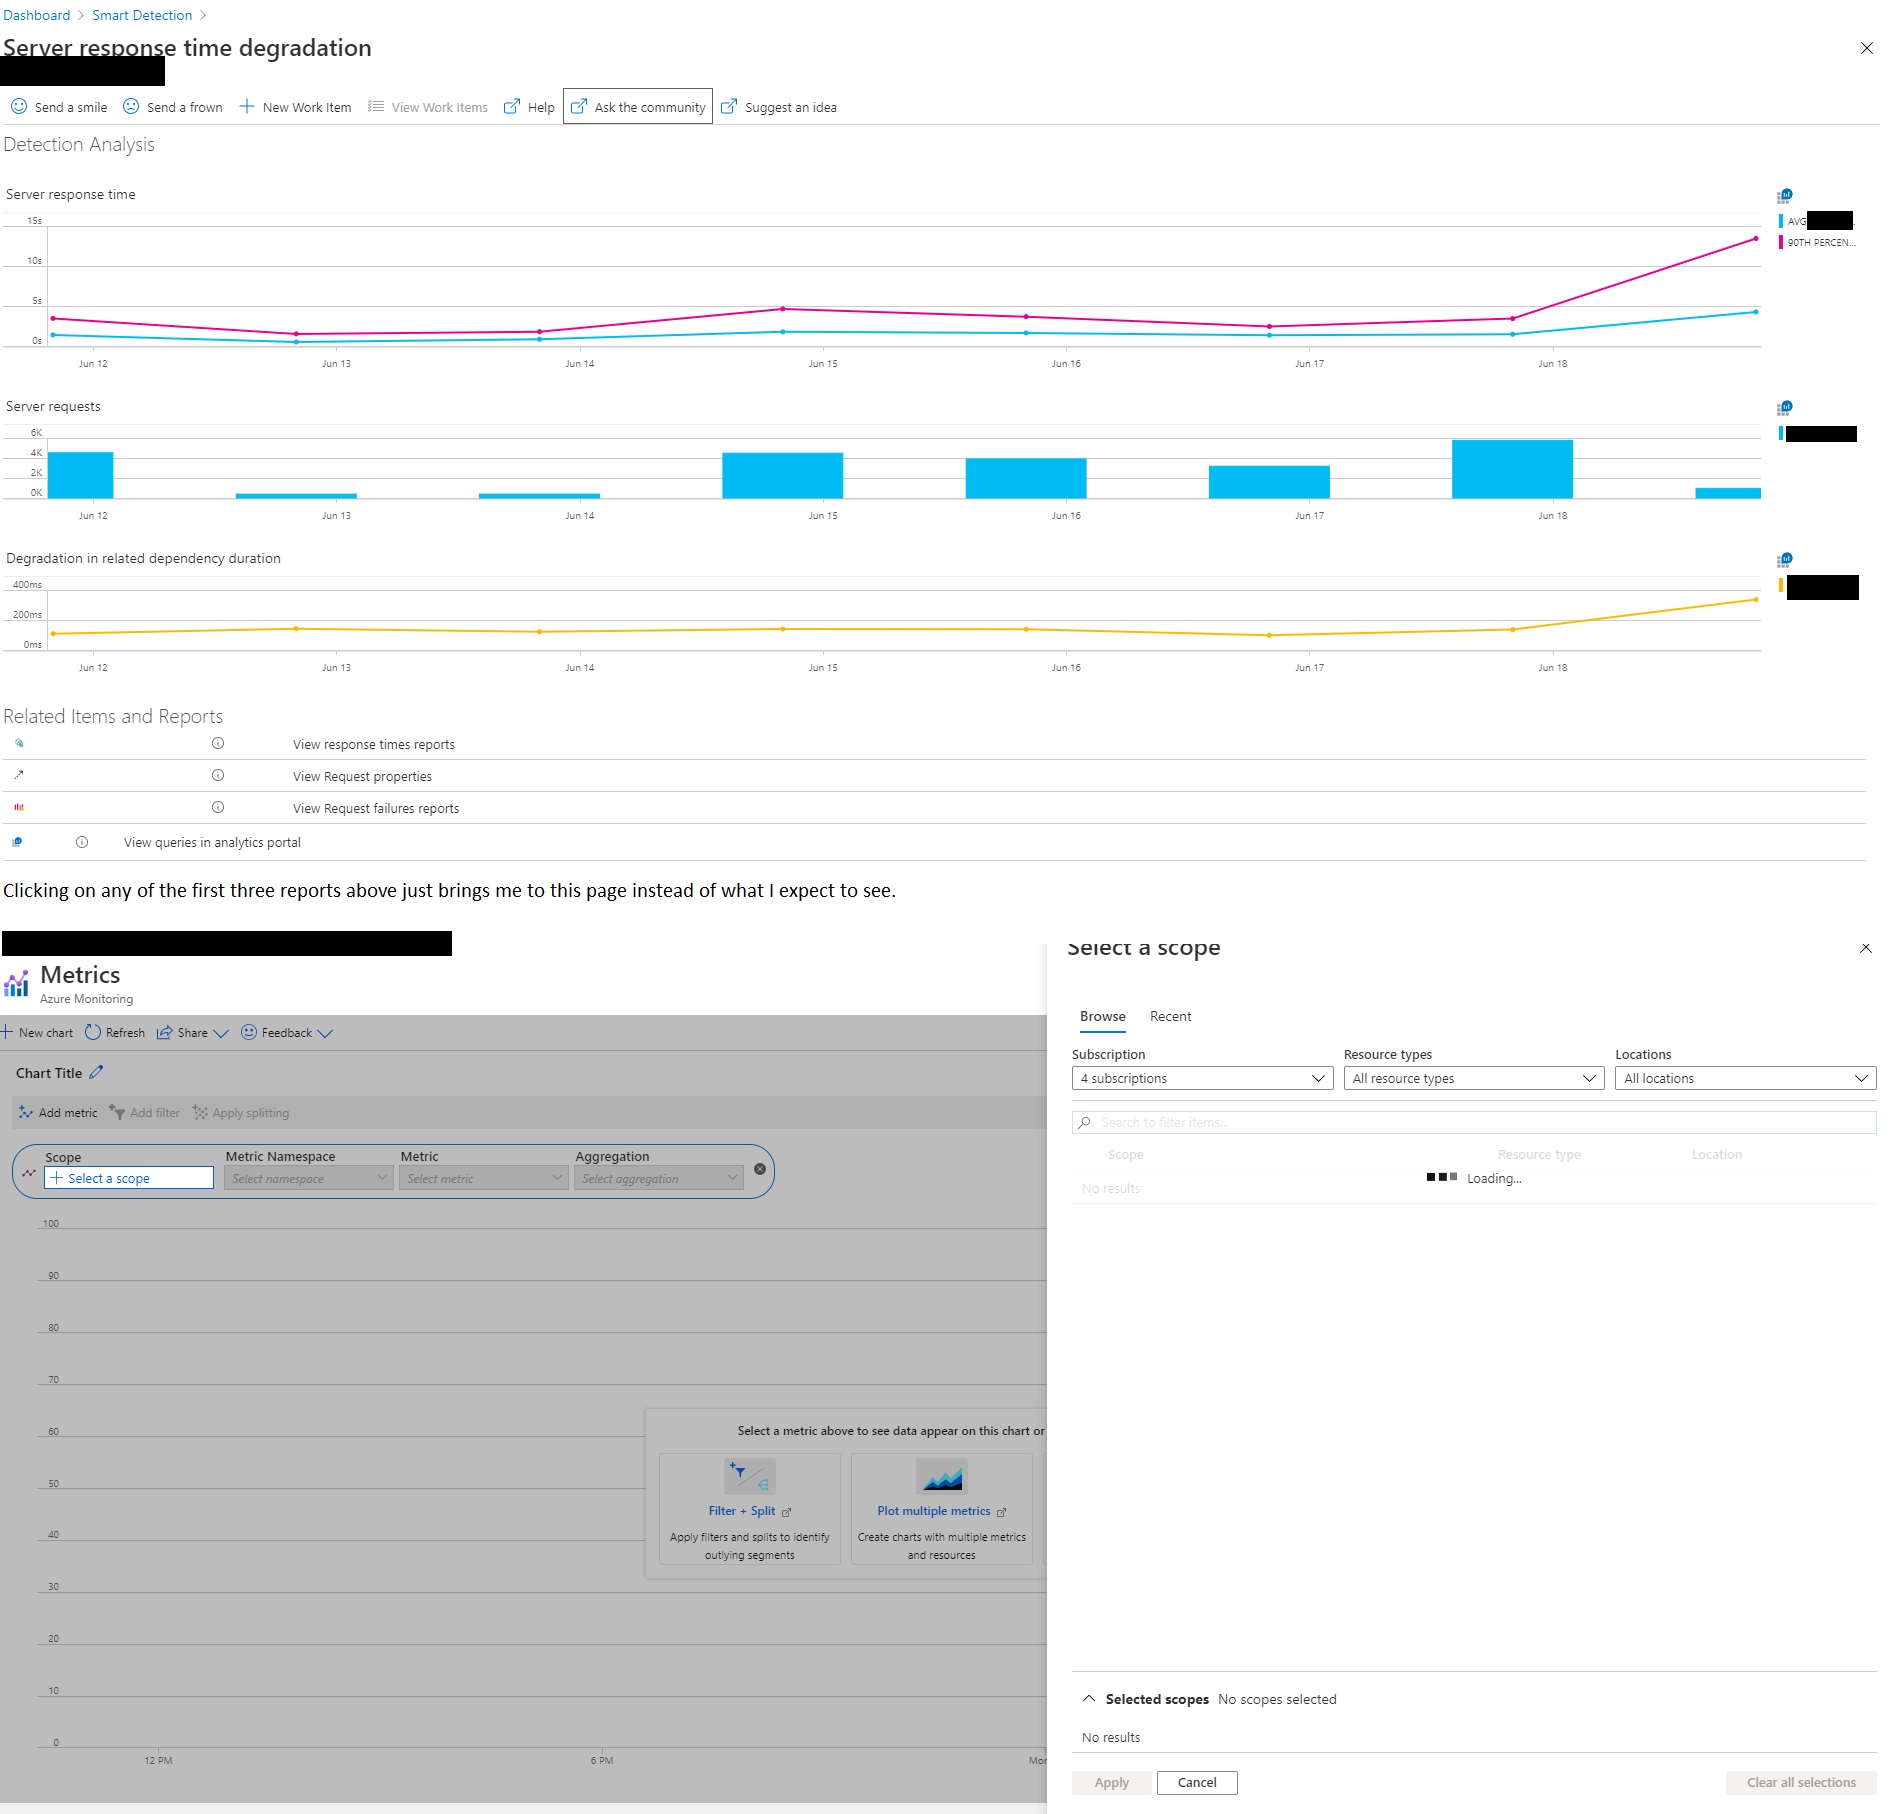
The reports in smart detection results for a respopnse time degradation only want to show me metrics instead of the nice drill down with samples over time, etc
It literally goes right to a metrics chart instead of showing me samples, drill down, etc.
This is not what I expected to see here, and not what I remember being able to do from a response time degradation alert. Is this bugged or now by design?
Example:
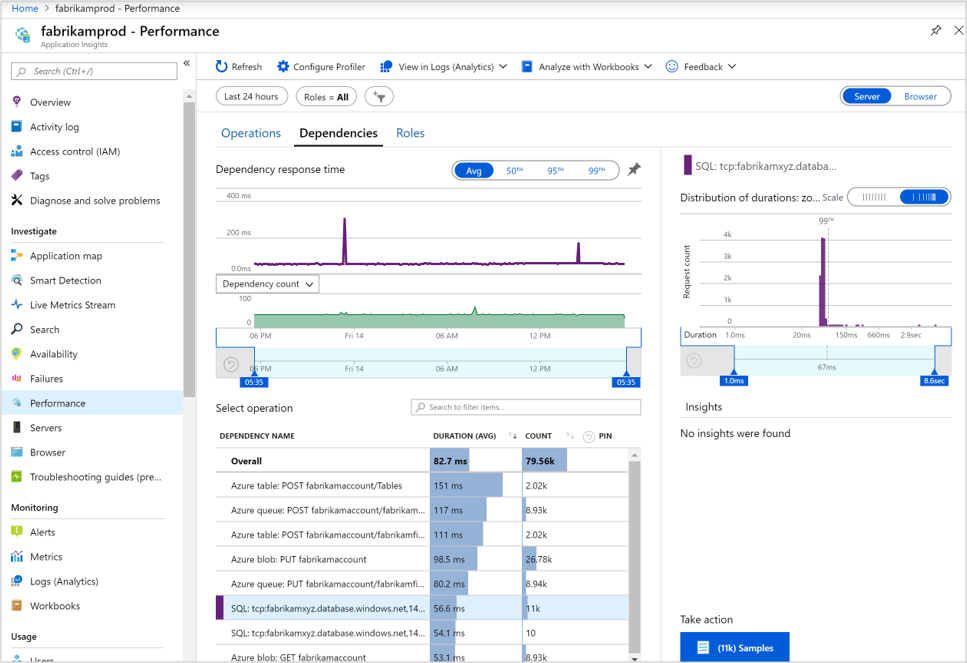
The page I'm talking about used to show a time based scatter chart that you could select ranges in as well as a Samples report on the right. It was similar to what is described here
The tag selections here are missing application-insights and I cant add it. Actually these tag selections are terrible.
@bharathn-msft - whats up with the lack of tags for application insights, or anything resembling things the portal actually offers? (App Service, Sql Database, etc)

@StingyJack Thank you for your query , application insights has been consolidated into Azure Monitor that's the reason we have azure-monitor has the tag. For additional details please refer here. For all other services supported in Microsoft Q&A please refer to this navigation page.
Regarding the behavior you are seeing with Smart Detection , sorry the experience you are having with the smart detection UI. I have reached out to our internal product team to get further details to understand this further, will keep you updated accordingly.
Thanks for the assist offer, but I've already opened a support case for it and its been forwarded to the product team already. In working with support I found that changing the url that the email notification launches to use the preview.portal.azure.com subdomain allows the correct reports to show up.
@StingyJack Thanks a lot for circling back and sharing additional information. Please feel free to update the work around or solution as an answer for this thread so that it helps other community members.
This had to be rectified by Support. I was not able to find out what was done to correct it, but it started working a few hours after the support request had been forwarded to the engineering team.
@StingyJack Based on the support ticket status, updating this thread for broader community usage. Thanks again for reaching out to us.
Expected reports were available on preview.portal.azure.com as a work around , however currently reports are available on the main portal itself. Thank you