crash video tdr failure unable to fix

Anonymous
2024-10-30T12:15:18+00:00

i know little to nothing about computers and i just got a prebuilt omen pc and it is crashing due to VIDEO_TDR_FAILURE

this is a screenshot from system information incase it is needed
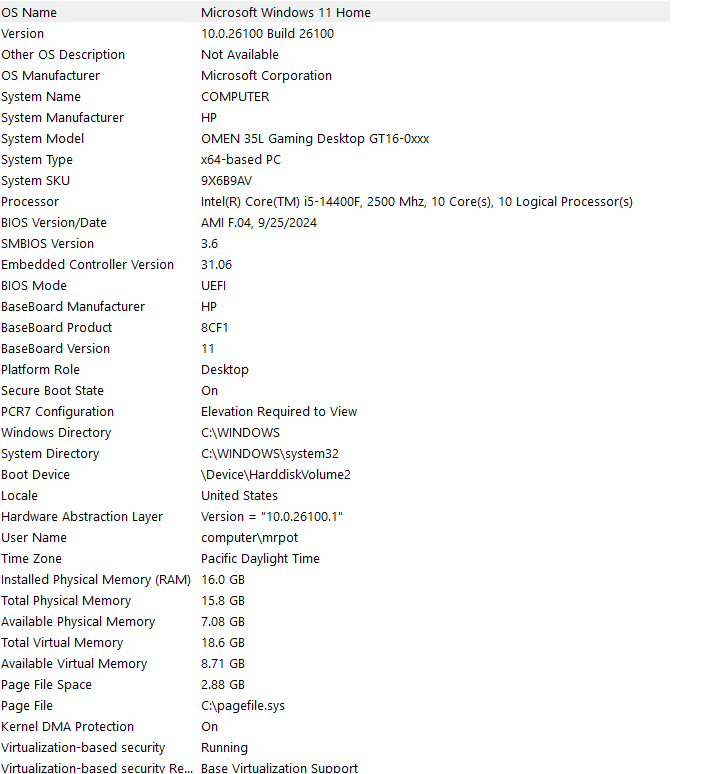
i have a nvidia rtx 4060 gpu

i have already looked up this problem and i have yet to find a solution that works or that i understand how to do

so far i have reset windows and deleted and installed older nvidia drivers

in event viewer i also have gotten these same errors every time there is a crash

The l1vhlwf service failed to start due to the following error: 

A hypervisor feature is not available to the user.

and

The driver \Driver\WUDFRd failed to load.

Device: PCI\VEN_8086&DEV_461D&SUBSYS_8CF1103C&REV_02\3&11583659&1&20

Status: 0xC0000365

this is the minidump of the crash analyzed by windbg

VIDEO_TDR_FAILURE (116) Attempt to reset the display driver and recover from timeout failed. Arguments: Arg1: ffff838001a93010, Optional pointer to internal TDR recovery context (TDR_RECOVERY_CONTEXT). Arg2: fffff801661d1120, The pointer into responsible device driver module (e.g. owner tag). Arg3: ffffffffc000009a, Optional error code (NTSTATUS) of the last failed operation. Arg4: 0000000000000004, Optional internal context dependent data.

Debugging Details:

Unable to load image nvlddmkm.sys, Win32 error 0n2 *** WARNING: Unable to verify timestamp for nvlddmkm.sys

KEY_VALUES_STRING: 1

Key  : Analysis.CPU.mSec
Value: 1609

Key  : Analysis.Elapsed.mSec
Value: 3526

Key  : Analysis.IO.Other.Mb
Value: 7

Key  : Analysis.IO.Read.Mb
Value: 1

Key  : Analysis.IO.Write.Mb
Value: 31

Key  : Analysis.Init.CPU.mSec
Value: 593

Key  : Analysis.Init.Elapsed.mSec
Value: 9323

Key  : Analysis.Memory.CommitPeak.Mb
Value: 102

Key  : Analysis.Version.DbgEng
Value: 10.0.27725.1000

Key  : Analysis.Version.Description
Value: 10.2408.27.01 amd64fre

Key  : Analysis.Version.Ext
Value: 1.2408.27.1

Key  : Bugcheck.Code.LegacyAPI
Value: 0x116

Key  : Bugcheck.Code.TargetModel
Value: 0x116

Key  : Failure.Bucket
Value: 0x116\_IMAGE\_nvlddmkm.sys

Key  : Failure.Hash
Value: {c89bfe8c-ed39-f658-ef27-f2898997fdbd}

Key  : Hypervisor.Enlightenments.ValueHex
Value: 7417df84

Key  : Hypervisor.Flags.AnyHypervisorPresent
Value: 1

Key  : Hypervisor.Flags.ApicEnlightened
Value: 0

Key  : Hypervisor.Flags.ApicVirtualizationAvailable
Value: 1

Key  : Hypervisor.Flags.AsyncMemoryHint
Value: 0

Key  : Hypervisor.Flags.CoreSchedulerRequested
Value: 0

Key  : Hypervisor.Flags.CpuManager
Value: 1

Key  : Hypervisor.Flags.DeprecateAutoEoi
Value: 1

Key  : Hypervisor.Flags.DynamicCpuDisabled
Value: 1

Key  : Hypervisor.Flags.Epf
Value: 0

Key  : Hypervisor.Flags.ExtendedProcessorMasks
Value: 1

Key  : Hypervisor.Flags.HardwareMbecAvailable
Value: 1

Key  : Hypervisor.Flags.MaxBankNumber
Value: 0

Key  : Hypervisor.Flags.MemoryZeroingControl
Value: 0

Key  : Hypervisor.Flags.NoExtendedRangeFlush
Value: 0

Key  : Hypervisor.Flags.NoNonArchCoreSharing
Value: 1

Key  : Hypervisor.Flags.Phase0InitDone
Value: 1

Key  : Hypervisor.Flags.PowerSchedulerQos
Value: 0

Key  : Hypervisor.Flags.RootScheduler
Value: 0

Key  : Hypervisor.Flags.SynicAvailable
Value: 1

Key  : Hypervisor.Flags.UseQpcBias
Value: 0

Key  : Hypervisor.Flags.Value
Value: 55185662

Key  : Hypervisor.Flags.ValueHex
Value: 34a10fe

Key  : Hypervisor.Flags.VpAssistPage
Value: 1

Key  : Hypervisor.Flags.VsmAvailable
Value: 1

Key  : Hypervisor.RootFlags.AccessStats
Value: 1

Key  : Hypervisor.RootFlags.CrashdumpEnlightened
Value: 1

Key  : Hypervisor.RootFlags.CreateVirtualProcessor
Value: 1

Key  : Hypervisor.RootFlags.DisableHyperthreading
Value: 0

Key  : Hypervisor.RootFlags.HostTimelineSync
Value: 1

Key  : Hypervisor.RootFlags.HypervisorDebuggingEnabled
Value: 0

Key  : Hypervisor.RootFlags.IsHyperV
Value: 1

Key  : Hypervisor.RootFlags.LivedumpEnlightened
Value: 1

Key  : Hypervisor.RootFlags.MapDeviceInterrupt
Value: 1

Key  : Hypervisor.RootFlags.MceEnlightened
Value: 1

Key  : Hypervisor.RootFlags.Nested
Value: 0

Key  : Hypervisor.RootFlags.StartLogicalProcessor
Value: 1

Key  : Hypervisor.RootFlags.Value
Value: 1015

Key  : Hypervisor.RootFlags.ValueHex
Value: 3f7

Key  : WER.OS.Branch
Value: ge\_release

Key  : WER.OS.Version
Value: 10.0.26100.1

BUGCHECK_CODE: 116

BUGCHECK_P1: ffff838001a93010

BUGCHECK_P2: fffff801661d1120

BUGCHECK_P3: ffffffffc000009a

BUGCHECK_P4: 4

FILE_IN_CAB: 102924-9375-01.dmp

TAG_NOT_DEFINED_202b: *** Unknown TAG in analysis list 202b

FAULTING_THREAD: ffff838feabda3c0

VIDEO_TDR_CONTEXT: dt dxgkrnl!_TDR_RECOVERY_CONTEXT ffff838001a93010 Symbol dxgkrnl!_TDR_RECOVERY_CONTEXT not found.

PROCESS_OBJECT: 0000000000000004

BLACKBOXBSD: 1 (!blackboxbsd)

BLACKBOXNTFS: 1 (!blackboxntfs)

BLACKBOXPNP: 1 (!blackboxpnp)

BLACKBOXWINLOGON: 1

CUSTOMER_CRASH_COUNT: 1

PROCESS_NAME: System

STACK_TEXT:
ffffa683682a7808 fffff8014a78942d : 0000000000000116 ffff838001a93010 fffff801661d1120 ffffffffc000009a : nt!KeBugCheckEx ffffa683682a7810 fffff8014aa1869e : fffff801661d1120 ffff838fe4ac7810 0000000000002000 ffff838fe4ac78d0 : dxgkrnl!TdrBugcheckOnTimeout+0x101 ffffa683682a7850 fffff8014a798371 : ffff838fee57e000 0000000000000000 0000000000000004 0000000000000000 : dxgkrnl!ADAPTER_RENDER::Reset+0x12a ffffa683682a7880 fffff8014a7ce695 : 0000000000000100 ffff838feabda500 ffff838f00000000 00000000ffffff7f : dxgkrnl!DXGADAPTER::Reset+0x589 ffffa683682a7910 fffff8014a7ce7f2 : fffff8014a31a750 ffff838fd14cc8e0 0000000000000000 ffff838fd3da0000 : dxgkrnl!TdrResetFromTimeout+0x15 ffffa683682a7940 fffff801b77151a2 : ffff838feabda3c0 ffff838fd14e6b20 ffffa683682a7a00 ffff838f00000000 : dxgkrnl!TdrResetFromTimeoutWorkItem+0x22 ffffa683682a7980 fffff801b785652a : ffff838feabda3c0 ffff838feabda3c0 fffff801b7714ff0 ffff838fd14e6b20 : nt!ExpWorkerThread+0x1b2 ffffa683682a7b30 fffff801b7a74c94 : fffff8014622f180 ffff838feabda3c0 fffff801b78564d0 0065006500700053 : nt!PspSystemThreadStartup+0x5a ffffa683682a7b80 0000000000000000 : ffffa683682a8000 ffffa683682a1000 0000000000000000 0000000000000000 : nt!KiStartSystemThread+0x34

SYMBOL_NAME: nvlddmkm+1621120

MODULE_NAME: nvlddmkm

IMAGE_NAME: nvlddmkm.sys

STACK_COMMAND: .process /r /p 0xffff838fd14d9040; .thread 0xffff838feabda3c0 ; kb

FAILURE_BUCKET_ID: 0x116_IMAGE_nvlddmkm.sys

OS_VERSION: 10.0.26100.1

BUILDLAB_STR: ge_release

OSPLATFORM_TYPE: x64

OSNAME: Windows 10

FAILURE_ID_HASH: {c89bfe8c-ed39-f658-ef27-f2898997fdbd}

Followup: MachineOwner

i really most importantly want to know if this can be determined as a issue with some setting or program or if this is a hardware issue because then if it is i will just take the pc back

Windows for home | Windows 11 | Performance and system failures

Locked Question. This question was migrated from the Microsoft Support Community. You can vote on whether it's helpful, but you can't add comments or replies or follow the question.

0 comments No comments

12 answers

Sort by: Most helpful
  1. Anonymous
    2025-01-17T01:27:24+00:00

    To summarize what is written above - I suspect that the problem is not the TDR itself. It simply tries to recover the system from a suspected freeze. On my system it fails causing a crash. I am going to disable the TDR, reproduce the original problem and try to find where it comes from.

    To do so under HKEY_LOCAL_MACHINE\SYSTEM\CurrentControlSet\Control\GraphicsDrivers going to set TdrLevel to 0
    and enable generating kernel crash from keyboard.

    https://learn.microsoft.com/en-us/windows-hardware/drivers/debugger/forcing-a-system-crash-from-the-keyboard
    Next time the machine will freeze instead of crashing. During the freeze I am going to generate a kernel dump and find what is going on.

    Plan to keep Timeout Detection and Recovery (TDR) disabled on my machine since it does not work anyway.

    1 day later - still no crashes.
    2 days later - finally got my freeze, but was unable to generate the dump. Will retest that dump works and try again. If dump from keyboard does not work I will need to connect another computer as debugger...

    4 days latter I got my crash dump. Analyzing. The most confusing thing is that initiating the crash from keyboard will not produce expected blue screen since display driver is dead. So when crashing - be patient and let windows collect the crash dump.

    Was this answer helpful?

    0 comments No comments
  2. Anonymous
    2025-01-17T01:17:03+00:00

    TL;DRI will write a long post here to show my investigation that hopefully will be useful for later analysis. My windows is constantly crashing with the same problem. Seems totally unrelated to anything I run - just sporadically happen in background when my computer is doing nothing. Took several full memory dumps. All shows the same NVIDIA driver crashing with

    VIDEO_TDR_FAILURE (116)
    Attempt to reset the display driver and recover from timeout failed.
    Arguments:
    Arg1: ffffcb0cad7cd010, Optional pointer to internal TDR recovery context (TDR_RECOVERY_CONTEXT).
    Arg2: fffff8046d921a40, The pointer into responsible device driver module (e.g. owner tag).
    Arg3: ffffffffc000009a, Optional error code (NTSTATUS) of the last failed operation.
    Arg4: 0000000000000004, Optional internal context dependent data.
    
    I have AMD Rynzen 9950X on x870E chipset, 64GB RAM and RTX3090. The RTX3090 was running just perfect for almost 3 years in my old computer. 
    This is the problem I see after installing the AMD computer from scratch. 
    Tried to reduce memory frequency, test memory and other hardware - all stable. 
    No crashes in games or when overloading the CPU. Stress tests pass normally. This is a clearly NVIDIA driver related issue.  
    I have my AMD internal display adapter disabled in firmware (trying not to call it BIOS anymore 8-) ). 
    I am running relatively clean windows 11 pro latest version. The crash comes from dxgkrnl, but complaining about nvidia driver .
    
    My stack looks like:
    
    STACK_TEXT:  
    fffffe08`32397248 fffff804`2750b5ad     : 00000000`00000116 ffffcb0c`ad7cd010 fffff804`6d921a40 ffffffff`c000009a : nt!KeBugCheckEx
    fffffe08`32397250 fffff804`27795bbe     : fffff804`6d921a40 ffffcb0c`8777b6e0 00000000`00002000 ffffcb0c`8777b7a0 : dxgkrnl!TdrBugcheckOnTimeout+0x101
    fffffe08`32397290 fffff804`2751a4f1     : ffffcb0c`878b9000 00000000`00000000 00000000`00000004 00000000`00000000 : dxgkrnl!ADAPTER_RENDER::Reset+0x12a
    fffffe08`323972c0 fffff804`27550935     : ffffa300`0bec0180 ffffcb0c`ae1a7040 ffffcb0c`00000000 00000000`00000000 : dxgkrnl!DXGADAPTER::Reset+0x589
    fffffe08`32397350 fffff804`27550a92     : ffffcb0c`97df5f90 ffffcb0c`7856ef00 00000000`00000000 ffffcb0c`9bc61000 : dxgkrnl!TdrResetFromTimeout+0x15
    fffffe08`32397380 fffff804`937704a2     : ffffcb0c`ae1a7040 ffffcb0c`78613ae0 ffffcb0c`78613a00 fffff804`00000000 : dxgkrnl!TdrResetFromTimeoutWorkItem+0x22
    fffffe08`323973c0 fffff804`9385585a     : ffffcb0c`ae1a7040 ffffcb0c`ae1a7040 fffff804`937702f0 ffffcb0c`78613ae0 : nt!ExpWorkerThread+0x1b2
    fffffe08`32397570 fffff804`93a7ae54     : ffffa300`0bd2a180 ffffcb0c`ae1a7040 fffff804`93855800 356c8500`2073de1e : nt!PspSystemThreadStartup+0x5a
    fffffe08`323975c0 00000000`00000000     : fffffe08`32398000 fffffe08`32391000 00000000`00000000 00000000`00000000 : nt!KiStartSystemThread+0x34
    
    SYMBOL_NAME:  nvlddmkm!nvDumpConfig+7783a0
    
    MODULE_NAME: nvlddmkm
    
    IMAGE_NAME:  nvlddmkm.sys
    
    STACK_COMMAND:  .cxr; .ecxr ; kb
    
    FAILURE_BUCKET_ID:  0x116_IMAGE_nvlddmkm.sys
    
    OS_VERSION:  10.0.26100.1
    
    kd> lmDvmnvlddmkm
    Browse full module list
    start             end                 module name
    fffff804`6c220000 fffff804`70c8b000   nvlddmkm   (export symbols)       nvlddmkm.sys
        Loaded symbol image file: nvlddmkm.sys
        Image path: \SystemRoot\System32\DriverStore\FileRepository\nvaki.inf_amd64_3b385ae0a2db520a\nvlddmkm.sys
        Image name: nvlddmkm.sys
        Browse all global symbols  functions  data
        Timestamp:        Tue Dec  3 22:17:19 2024 (674F674F)
        CheckSum:         048CB9A6
        ImageSize:        04A6B000
        Translations:     0000.04b0 0000.04e4 0409.04b0 0409.04e4
        Information from resource tables:
    
    What I see that the crash never happens just after machine starts and it happens after monitor.sys 
    driver was loaded and unloaded many times. At this point I dont know if it is related. 
    
    Unloaded modules: 
    
    fffff803`570f0000 fffff803`57111000   monitor.sys 
    
    fffff803`57900000 fffff803`57921000   monitor.sys 
    
    ... like 50 more
    
    I have tried to spent some time debugging the problem (I dont understand much in video driver development 
    or directx, but do have some kernel knowledge). From what I can understand from here:
    
    https://groups.google.com/g/microsoft.public.windbg/c/w6bkObbQQE0/m/CWJqyn3GwKAJ?pli=1 
    
    The issue happens if a driver do not release user space for more than 5 seconds holding it inside a system call.
    
    First let's see the locks:
    1: kd> !locks
    KD: Scanning for held locks........................................................................
    **** DUMP OF ALL RESOURCE OBJECTS ****
    
    Fast Resource @ 0xffffcb0c85b96710    Shared 5 owning threads
        Contention Count = 28996
        NumberOfSharedWaiters = 4
        NumberOfExclusiveWaiters = 15
        LockWord: Exclusive = 0, Conflict = 1, ShareCount = 1
         Threads: ffffcb0c94e8b080-01<*> ffffcb0cae755080-01    ffffcb0caafec040-01    ffffcb0cae770080-01    
                  ffffcb0cae19b080-01    
    
         Threads Waiting On Exclusive Access:
                  ffffcb0c8aaed080       ffffcb0cad686080       ffffcb0caaede080       ffffcb0cac15c080       
                  ffffcb0c8f9950c0       ffffcb0c9c454080       ffffcb0c94fc1080       ffffcb0c8a9340c0       
                  ffffcb0cacdf6080       ffffcb0ca862b080       ffffcb0ca21d5080       ffffcb0c8fe24080       
                  ffffcb0c9a70d040       ffffcb0ca64ec080       ffffcb0c95f6c080       
    
    Fast Resource @ 0xffffcb0c872a4390    Shared 28 owning threads
        Contention Count = 26507242
        NumberOfSharedWaiters = 27
        NumberOfExclusiveWaiters = 153
        LockWord: Exclusive = 0, Conflict = 1, ShareCount = 1
         Threads: ffffcb0c94fac080-01    ffffcb0ca21f6080-01<*> ffffcb0c8b0f0080-01    ffffcb0c8b367080-01    
                  ffffcb0c8b892080-01    ffffcb0c9c546080-01    ffffcb0c984cd0c0-01    ffffcb0ca2de3040-01    
                  ffffcb0ca2ecf040-01    ffffcb0caa6eb080-01    ffffcb0cadca80c0-01    ffffcb0cab7f2080-01    
                  ffffcb0cac0ae080-01    ffffcb0ca6d5e040-01    ffffcb0cac62a040-01    ffffcb0c98f42080-01    
                  ffffcb0cabbf1040-01    ffffcb0c9bcd2080-01    ffffcb0ca2204040-01    ffffcb0caaec9040-01    
                  ffffcb0c94a4b0c0-01    ffffcb0ca6db5080-01    ffffcb0ca2ecb040-01    ffffcb0cac6d0040-01    
                  ffffcb0cadfb7080-01    ffffcb0cabacc080-01    ffffcb0cae1f0080-01    ffffcb0cabc60040-01    
    
         Threads Waiting On Exclusive Access:
                  ffffcb0cae0e1080       ffffcb0ca6c60080       ffffcb0ca6c5f080       ffffcb0c9cf48080       
                  ffffcb0ca6c5e080       ffffcb0ca6c61080       ffffcb0ca6d09080       ffffcb0ca6c5d080       
                  ffffcb0ca6d08080       ffffcb0ca6d07080       ffffcb0ca68a2080       ffffcb0ca68a3080       
                  ffffcb0ca6d1e080       ffffcb0ca7c31080       ffffcb0cad2f0080       ffffcb0c9cda2080       
                  ffffcb0c986d6080       ffffcb0c99b75080       ffffcb0c8ae0e080       ffffcb0c98b99080       
                  ffffcb0c98475080       ffffcb0cad0e2080       ffffcb0cae1e3080       ffffcb0ca89d6080       
                  ffffcb0c945eb080       ffffcb0cadd63080       ffffcb0c9805e080       ffffcb0caba85080       
                  ffffcb0ca22dd080       ffffcb0ca6f4e0c0       ffffcb0ca68ef080       ffffcb0c938730c0       
                  ffffcb0ca8452080       ffffcb0c8a7f7080       ffffcb0ca8453080       ffffcb0ca74ce080       
                  ffffcb0ca6a4a080       ffffcb0ca6a3b080       ffffcb0ca382a080       ffffcb0ca6d1c080       
                  ffffcb0ca6480080       ffffcb0c8a6e2080       ffffcb0c8b9ba0c0       ffffcb0c9c982080       
                  ffffcb0c949ce080       ffffcb0c9ce62080       ffffcb0c9bdb1080       ffffcb0c9cadc080       
                  ffffcb0c9bdb3080       ffffcb0c9c62e080       ffffcb0c998b2080       ffffcb0c9b3e3080       
                  ffffcb0c9baf1080       ffffcb0c9ba68080       ffffcb0c984b0080       ffffcb0c9a59e080       
                  ffffcb0c9a5a0080       ffffcb0c94858080       ffffcb0c98c51080       ffffcb0c9a184080       
                  ffffcb0c9936a080       ffffcb0c8ad06080       ffffcb0c98cac080       ffffcb0c982c5080       
                  ffffcb0c986870c0       ffffcb0c986df080       ffffcb0c984ce080       ffffcb0c984c5080       
                  ffffcb0c984d4080       ffffcb0c98125080       ffffcb0c98127080       ffffcb0c984d7080       
                  ffffcb0c984da080       ffffcb0c984d5080       ffffcb0c98462080       ffffcb0c982e2080       
                  ffffcb0c98324080       ffffcb0c8b8e9080       ffffcb0c982a0080       ffffcb0c982a1080       
                  ffffcb0c8b357080       ffffcb0c8bf87040       ffffcb0c93caa080       ffffcb0c8b3cb080       
                  ffffcb0c8b3650c0       ffffcb0c8b276080       ffffcb0c938dc0c0       ffffcb0c99fd2080       
                  ffffcb0c97ee9080       ffffcb0c9af21080       ffffcb0c9a7b7080       ffffcb0c99748080       
                  ffffcb0c98b5a080       ffffcb0c98f40080       ffffcb0cad698080       ffffcb0ca6ef1040       
                  ffffcb0ca6d17080       ffffcb0c8bf96080       ffffcb0c9c288080       ffffcb0c8faed0c0       
                  ffffcb0c9393f0c0       ffffcb0c9a6db0c0       ffffcb0c94f81080       ffffcb0c9c26b080       
                  ffffcb0cabcea080       ffffcb0c997e8080       ffffcb0c98c45080       ffffcb0ca2df3040       
                  ffffcb0c98719080       ffffcb0ca7462080       ffffcb0ca5dca080       ffffcb0c9985b080       
                  ffffcb0c99a020c0       ffffcb0ca6ec80c0       ffffcb0c9cbb7080       ffffcb0c9caee080       
                  ffffcb0cac7240c0       ffffcb0c8f299040       ffffcb0c99b9b0c0       ffffcb0c98f43080       
                  ffffcb0c988cb080       ffffcb0c9bb7c080       ffffcb0c9bfb3080       ffffcb0cac4d6080       
                  ffffcb0cac64a080       ffffcb0ca6cdd080       ffffcb0c8a6ae080       ffffcb0cadfa50c0       
                  ffffcb0c95d30080       ffffcb0ca7027080       ffffcb0c99fe0080       ffffcb0ca6ecc080       
                  ffffcb0c916230c0       ffffcb0c9bac50c0       ffffcb0c95df9080       ffffcb0ca7178080       
                  ffffcb0c9af870c0       ffffcb0cae493080       ffffcb0caa50a080       ffffcb0caa7d5080       
                  ffffcb0caaeef080       ffffcb0c8a29c080       ffffcb0cae32f080       ffffcb0ca2fc8080       
                  ffffcb0c7becc040       ffffcb0c9997f080       ffffcb0ca3187080       ffffcb0caaec8080       
                  ffffcb0cad1e40c0       ffffcb0ca2fe60c0       ffffcb0c98716080       ffffcb0ca2180040       
                  ffffcb0ca83c6080       
    KD: Scanning for held locks........................................................................................
    
    Resource @ 0xffffcb0c8579fee0    Shared 1 owning threads
        Contention Count = 36
         Threads: ffffcb0ca21f6080-01<*> 
    
    Resource @ 0xffffcb0c857a00c8    Shared 1 owning threads
        Contention Count = 64
         Threads: ffffcb0ca21f6080-01<*> 
    KD: Scanning for held locks.....................
    
    Resource @ 0xffffcb0c872aa090    Exclusively owned
        Contention Count = 420
         Threads: ffffcb0cae1a7040-01<*> 
    KD: Scanning for held 
    117131 total locks, 5 locks currently held
    
    Fast Resource 0xffffcb0c85b96710 It is actively owned by
    
    1: kd> !thread ffffcb0c94e8b080 0x1f
    THREAD ffffcb0c94e8b080  Cid 1008.12bc  Teb: 000000e724ace000 Win32Thread: ffffcb0c94c83d80 WAIT: (WrPushLock) KernelMode Non-Alertable
        fffffe082f926f90  SynchronizationEvent
    Not impersonating
    DeviceMap                 ffffdc053c213220
    Owning Process            ffffcb0c94bb4080       Image:         NVDisplay.Container.exe
    Attached Process          N/A            Image:         N/A
    Wait Start TickCount      851780         Ticks: 5443 (0:00:01:25.046)
    Context Switch Count      15831          IdealProcessor: 1             
    UserTime                  00:00:01.359
    KernelTime                00:00:18.171
    Win32 Start Address _nvtopps!NvPluginGetInfo (0x00007ffa92decb4c)
    Stack Init fffffe082f9275f0 Current fffffe082f926bd0
    Base fffffe082f928000 Limit fffffe082f921000 Call 0000000000000000
    Shadow Stack Init ffffb3040053cff0 Current ffffb3040053cf90
    Shadow Stack Base ffffb3040053e000 Limit ffffb3040053b000
    Priority 16  BasePriority 8  Priority Floor 16  IoPriority 2  PagePriority 5
    Child-SP          RetAddr               Call Site
    fffffe08`2f926c10 fffff804`93743788     nt!KiSwapContext+0x76
    fffffe08`2f926d50 fffff804`93672d83     nt!KiSwapThread+0x928
    fffffe08`2f926de0 fffff804`93673a44     nt!KiCommitThreadWait+0x483
    fffffe08`2f926e70 fffff804`93674e9c     nt!KeWaitForSingleObject+0x7a4
    fffffe08`2f926f50 fffff804`9367402d     nt!ExfAcquirePushLockSharedEx+0x1dc
    fffffe08`2f927010 fffff804`273a7d49     nt!ExAcquirePushLockSharedEx+0x4d
    fffffe08`2f927050 fffff804`276d58f0     dxgkrnl!DXGADAPTERSTOPRESETLOCKSHARED::Acquire+0x49
    fffffe08`2f927080 fffff804`276d4b05     dxgkrnl!EnumAdaptersCallback+0xc0
    fffffe08`2f9271a0 fffff804`276d441d     dxgkrnl!DxgkEnumAdaptersInternal+0x1a5
    fffffe08`2f927280 fffff804`276d4235     dxgkrnl!DxgkEnumAdapters3Impl+0x1cd
    fffffe08`2f927430 fffff804`93a8d355     dxgkrnl!NtDxgkEnumAdapters3+0x15
    fffffe08`2f927460 00007ffa`a7833d14     nt!KiSystemServiceCopyEnd+0x25 (TrapFrame @ fffffe08`2f927460)
    000000e7`267ff388 00007ffa`91f67dfc     win32u!NtDxgkEnumAdapters3+0x14
    000000e7`267ff390 00000000`00000022     nvapi64+0x67dfc
    000000e7`267ff398 00000000`00000000     0x22
    which tries to enumerate adapters waits for the same directx
    
    Clearly Fast Resource 0xffffcb0c872a4390 owned by shared locker  and exclusive and other shared lockers wait for it. Many of them. 
    Moreover, it is owned by our thread with nvidia driver which in turn tries to wait for on some kernel event and thus cannot release the lock
    This fast resource seems to be related to wind32 subsystems and may not be the root cause, but rather a symptom that eventually leads to a timeout problem 
    inside the driver.
    
    1: kd> !thread ffffcb0ca21f6080 0x1f
    THREAD ffffcb0ca21f6080  Cid 0b64.70d8  Teb: 0000004f6e8be000 Win32Thread: ffffcb0caa672c30 WAIT: (Executive) KernelMode Non-Alertable
        ffffcb0c878b9030  NotificationEvent
    IRP List:
        ffffcb0caa7b6070: (0006,0118) Flags: 00060000  Mdl: 00000000
    Not impersonating
    DeviceMap                 ffffdc05492203d0
    Owning Process            ffffcb0c938d80c0       Image:         dwm.exe
    Attached Process          N/A            Image:         N/A
    Wait Start TickCount      853290         Ticks: 3933 (0:00:01:01.453)
    Context Switch Count      144            IdealProcessor: 16             
    UserTime                  00:00:00.000
    KernelTime                00:00:00.000
    Win32 Start Address ntdll!TppWorkerThread (0x00007ffaa9af1a00)
    Stack Init fffffe082cb385f0 Current fffffe082cb37920
    Base fffffe082cb39000 Limit fffffe082cb32000 Call 0000000000000000
    Shadow Stack Init ffffb3040454fff0 Current ffffb3040454ff70
    Shadow Stack Base ffffb30404551000 Limit ffffb3040454e000
    Priority 24  BasePriority 13  Priority Floor 24  IoPriority 2  PagePriority 5
    Child-SP          RetAddr               Call Site
    fffffe08`2cb37960 fffff804`93743788     nt!KiSwapContext+0x76
    fffffe08`2cb37aa0 fffff804`93672d83     nt!KiSwapThread+0x928
    fffffe08`2cb37b30 fffff804`93673a44     nt!KiCommitThreadWait+0x483
    fffffe08`2cb37bc0 fffff804`2763d892     nt!KeWaitForSingleObject+0x7a4
    fffffe08`2cb37ca0 fffff804`2763d643     dxgkrnl!DXGADAPTER::AcquireCoreSync+0x10e
    fffffe08`2cb37d00 fffff804`2763d40c     dxgkrnl!DxgkAcquireAdapterCoreSync+0x83
    fffffe08`2cb37d80 fffff804`277b827d     dxgkrnl!DpiAcquireCoreSyncAccessSafe+0xf4
    fffffe08`2cb37db0 fffff804`2773d70f     dxgkrnl!DpiGdoDispatchInternalIoctl+0x44d
    fffffe08`2cb37e60 fffff804`6d91fd42     dxgkrnl!DpiDispatchInternalIoctl+0xff
    fffffe08`2cb37f90 fffff804`936f79fe     nvlddmkm!nvDumpConfig+0x7766a2
    fffffe08`2cb37fd0 fffff804`28a282f8     nt!IofCallDriver+0xbe
    fffffe08`2cb38010 fffff804`28a26cc2     win32kbase!GreDeviceIoControlImpl+0x104
    fffffe08`2cb380b0 fffff804`28a26692     win32kbase!DrvEnumDisplayDevices+0x602
    fffffe08`2cb383e0 fffff804`2a7f39d2     win32kbase!NtUserEnumDisplayDevices+0x72
    fffffe08`2cb38420 fffff804`93a8d355     win32k!NtUserEnumDisplayDevices+0x52
    fffffe08`2cb38460 00007ffa`a7832f14     nt!KiSystemServiceCopyEnd+0x25 (TrapFrame @ fffffe08`2cb38460)
    0000004f`6eefddf8 00007ffa`a94109eb     win32u!NtUserEnumDisplayDevices+0x14
    0000004f`6eefde00 00007ffa`91296ea3     USER32!EnumDisplayDevicesW+0x9b
    0000004f`6eefe1d0 00007ffa`914243bb     mscms!ColorProfileGetDisplayDefault+0xe3
    0000004f`6eefec00 00007ffa`91424d92     DispBroker_Desktop!Microsoft::Windows::ColorManagement::ColorManagementRpcServer::DisplayObject::UpdateColorProfile+0x6c3
    0000004f`6eefee20 00007ffa`91424ca4     DispBroker_Desktop!Microsoft::Windows::ColorManagement::ColorManagementRpcServer::DisplayObject::UpdateDisplay+0x4a
    0000004f`6eefee60 00007ffa`914a6637     DispBroker_Desktop!Microsoft::Windows::ColorManagement::ColorManagementRpcServer::ColorManagementRpcServerImpl::UpdateDisplays+0x584
    0000004f`6eeff030 00007ffa`9143a200     DispBroker_Desktop!::operator()+0xdf
    0000004f`6eeff090 00007ffa`a9ad7ae4     DispBroker_Desktop!::+0x20
    0000004f`6eeff0c0 00007ffa`a9ad6f9f     ntdll!RtlpWnfWalkUserSubscriptionList+0x3a4
    0000004f`6eeff280 00007ffa`a9ad8c17     ntdll!RtlpWnfProcessCurrentDescriptor+0x11f
    0000004f`6eeff2e0 00007ffa`a9ad9319     ntdll!RtlpWnfNotificationThread+0x87
    0000004f`6eeff340 00007ffa`a9af1fa0     ntdll!TppExecuteWaitCallback+0x2a9
    0000004f`6eeff470 00007ffa`a8b0e8d7     ntdll!TppWorkerThread+0x5a0
    0000004f`6eeff7d0 00007ffa`a9b7fbcc     KERNEL32!BaseThreadInitThunk+0x17
    0000004f`6eeff800 00000000`00000000     ntdll!RtlUserThreadStart+0x2c
    
    Checking all threads of all processes, this is also the only thread that actually does anything active with nvlddmkm driver
    
    Resource 0xffffcb0c872aa090 is strange and probably unrelated. Held by IpOverUsbSvc.exe
    
    But two other Resources @ 0xffffcb0c8579fee0  is help by the same thread ffffcb0ca21f6080 with nvidia driver on stack. It is not 
    
    So far we have 3 resources held by the thread with nvidia driver on stack that is waiting for a directx event by itself and freezing the whole system.
    Now we need to find what is this dxgkrnl!DXGADAPTER::AcquireCoreSync
    
    Trying to dig a little bit in the stack it seems that this specific operation registers a kernel work item that if not unregistered will cause kernel reset. 
    I see it in the parameter of the ffffcb0c`8579f180 00000000`00000000 00000000`00000000 ffffcb0c`8579f180 : dxgkrnl!DxgkAcquireAdapterCoreSync+0x83
    The pointer actually points to the nvidia device:
    
    ffffcb0c`8579f180  ffffcb0c`8574d8e8
    ffffcb0c`8579f188  ffffcb0c`8574d8e8
    ffffcb0c`8579f190  00000002`74727044
    ffffcb0c`8579f198  ffffcb0c`8579f030
    ffffcb0c`8579f1a0  ffffcb0c`8579f030
    ffffcb0c`8579f1a8  ffffcb0c`8574d8b0
    ffffcb0c`8579f1b0  ffffcb0c`87ad9000
    ffffcb0c`8579f1b8  00000000`00010001
    ffffcb0c`8579f1c0  00000001`00000000
    ffffcb0c`8579f1c8  00000000`00060001
    ffffcb0c`8579f1d0  ffffcb0c`8579f1d0
    ffffcb0c`8579f1d8  ffffcb0c`8579f1d0
    ffffcb0c`8579f1e0  fffff804`2763ff40 dxgkrnl!DpiFdoDispatchCleanupAndClose
    ffffcb0c`8579f1e8  fffff804`2773a210 dxgkrnl!DpiFdoDispatchCreate
    ffffcb0c`8579f1f0  fffff804`275b8c40 dxgkrnl!DpiFdoDispatchInternalIoctl
    ffffcb0c`8579f1f8  fffff804`275b8f60 dxgkrnl!DpiFdoDispatchIoctl
    
    1: kd> !object ffffcb0c`8579f030
    Object: ffffcb0c8579f030  Type: (ffffcb0c78746bd0) Device
        ObjectHeader: ffffcb0c8579f000 (new version)
        HandleCount: 0  PointerCount: 1
    
    1: kd> !devobj ffffcb0c`8579f030
    Device object (ffffcb0c8579f030) is for:
      \Driver\nvlddmkm DriverObject ffffcb0c7bfdcd00
    Current Irp 00000000 RefCount 0 Type 00000023 Flags 00002004
    SecurityDescriptor ffffdc053c8c97e0 DevExt ffffcb0c8579f180 DevObjExt ffffcb0c857a0a70 
    ExtensionFlags (0000000000)  
    Characteristics (0x00000100)  FILE_DEVICE_SECURE_OPEN
    AttachedTo (Lower) ffffcb0c7b954df0 \Driver\ACPI
    Device queue is not busy.
    
    You can actually see that ffffcb0c8579f180 is the device extension
    
    The last thing is to understand the event which this thread waits for:
    1: kd> !object ffffcb0c878b9030
    Object: ffffcb0c878b9030  Type: (ffffcb0c78579ed0) DebugObject
        ObjectHeader: ffffcb0c878b9000 (new version)
        HandleCount: 18446685853533454336  PointerCount: 18446685853209170688
    
    Wow - this seems like a memory corruption.
    
    Object type is actually overwritten with some pointer with all other fields overwritten as well:
    1: kd> dt nt!_OBJECT_HEADER ffffcb0c878b9000
       +0x000 PointerCount     : 0n-58220500380928
       +0x008 HandleCount      : 0n-58220176097280
       +0x008 NextToFree       : 0xffffcb0c`8f15c000 Void
       +0x010 Lock             : _EX_PUSH_LOCK
       +0x018 TypeIndex        : 0xb2 ''
       +0x019 TraceFlags       : 0x16 ''
       +0x019 DbgRefTrace      : 0y0
       +0x019 DbgTracePermanent : 0y1
       +0x01a InfoMask         : 0 ''
       +0x01b Flags            : 0 ''
       +0x01b NewObject        : 0y0
       +0x01b KernelObject     : 0y0
       +0x01b KernelOnlyAccess : 0y0
       +0x01b ExclusiveObject  : 0y0
       +0x01b PermanentObject  : 0y0
       +0x01b DefaultSecurityQuota : 0y0
       +0x01b SingleHandleEntry : 0y0
       +0x01b DeletedInline    : 0y0
       +0x01c Reserved         : 0
       +0x020 ObjectCreateInfo : (null) 
       +0x020 QuotaBlockCharged : (null) 
       +0x028 SecurityDescriptor : 0xffffffff`ffffffff Void
       +0x030 Body             : _QUAD
    
    1: kd> dps ffffcb0c878b9000
    ffffcb0c`878b9000  ffffcb0c`7bc19300
    ffffcb0c`878b9008  ffffcb0c`8f15c000
    ffffcb0c`878b9010  ffffcb0c`7bc19000
    ffffcb0c`878b9018  00000000`000016b2
    ffffcb0c`878b9020  00000000`00000000
    ffffcb0c`878b9028  ffffffff`ffffffff
    ffffcb0c`878b9030  00000000`00060000
    ffffcb0c`878b9038  ffffcb0c`a21f61c0
    ffffcb0c`878b9040  ffffcb0c`a21f61c0
    ffffcb0c`878b9048  00000000`00000000
    ffffcb0c`878b9050  00000000`00000000
    ffffcb0c`878b9058  0000002c`00000000
    ffffcb0c`878b9060  00000000`ffffffff
    ffffcb0c`878b9068  00000000`00000000
    ffffcb0c`878b9070  00000000`00000000
    ffffcb0c`878b9078  0000004b`00000000
    
    This 00000000`000016b2 is a handle to 
    16b2: Object: ffffcb0c9a4a1c00  GrantedAccess: 001f0003 (Protected) (Audit) Entry: ffffdc0549556ac0
    Object: ffffcb0c9a4a1c00  Type: (ffffcb0c787dab10) IoCompletion
        ObjectHeader: ffffcb0c9a4a1bd0 (new version)
            HandleCount: 2  PointerCount: 65537
    
    1: kd> !findhandle ffffcb0c9a4a1c00
                                                                  
                       [ffffcb0c7856c040 System]
      16b0: Entry ffffdc0549556ac0 Granted Access 1f0003 (Protected) (Audit)
                                                                  
                       [ffffcb0c95d2f080 msedgewebview2]
       888: Entry ffffdc0552d9c220 Granted Access 1f0003 (Protected) (Audit)
    
    So it looks like use after free. 
    Maybe it is only a side effect of the kernel trying to reset the frozen driver which definitely does not work in my case. 
    
    I need to look how to disable this reset mechanism to find the initial root cause of the freeze.
    

    Was this answer helpful?

    0 comments No comments
  3. Anonymous
    2025-01-16T19:33:38+00:00

    Any updates or fixes to this? Been experiencing similar things since early November with my omen 25L with a 4060 ti 16gb. Constant video tdr blue screens unless I launch a game if I launch a game the computer doesn't crash.

    Was this answer helpful?

    0 comments No comments
  4. Anonymous
    2025-01-08T06:29:55+00:00

    Dear David,

    We are experiencing continuous system crashes on several machines, at independent locations and with different users. Video TDR failure, kernel-Power critical issue.

    Do you know about any fresh solution?

    Thanks

    Adam

    Was this answer helpful?

    0 comments No comments
  5. David-M 123.2K Reputation points Independent Advisor
    2024-10-30T12:53:13+00:00

    Hi. I'm David, and I'm happy to help you.

    The minidump information you shared indicates the driver "nvlddmkm.sys" as the cause of the crash. This driver belongs to your Nvidia graphics card.

    Usually, this is just a driver issue. However, I do not rule out this issue being caused by a hardware problem.

    Was the Nvidia driver you installed downloaded from the Nvidia website or the computer manufacturer's website?

    Before reinstalling the Nvidia driver, did you use the free DDU tool to remove the previous driver?

    This ensures a clean installation of the driver and may fix some issues.

    If you didn't use DDU, use it to remove the current driver, download the latest driver from the Nvidia website and reinstall it.

    DDU: https://www.guru3d.com/files-details/display-dr...

    Nvidia driver download: https://www.nvidia.com/en-us/drivers/details/23...

    Run the downloaded file and follow the on-screen instructions to install the driver.

    See if the system will work stable after this.

    If the crash occurs again after doing this, share the minidump it created. Click on the "Reply" button below my reply.

    If you need a tutorial for using DDU, I recommend the video below.

    https://www.youtube.com/watch?v=bP-2B14Nckw

    Feel free to ask back any questions.

    ________________________________________________________

    Standard Disclaimer: There are links to non-Microsoft websites. The pages appear to be providing accurate, safe information. Watch out for ads on the sites that may advertise products frequently classified as a PUP (Potentially Unwanted Products). Thoroughly research any product advertised on the sites before you decide to download and install it.

    Was this answer helpful?

    0 comments No comments
