Azure Cost Management
A Microsoft offering that enables tracking of cloud usage and expenditures for Azure and other cloud providers.
3,607 questions
This browser is no longer supported.
Upgrade to Microsoft Edge to take advantage of the latest features, security updates, and technical support.
' cx='32' cy='32' r='32' /%3E%3Ctext x='50%25' y='55%25' dominant-baseline='middle' text-anchor='middle' fill='%23FFF' %3EP1%3C/text%3E%3C/svg%3E)
I've seen the Normalized RU Consumption view in Azure CosmosDb Insights, and now I'm confused about Request Units. I hope someone can help to fix some issue or at least to clarify for better understanding.
In this case the application creates documents of 8kb in size. CosmosDB returns the request usage of 14 Request Units per Create.
This create action is executed 280 times per minute, which is about 5 requests per second.
This would mean this process would consume 5 x 14 = 70 request units each second.
If I provision 5000 RU/s for that container, I actually provision 5000 Request Units per second, right? (RU/s is Request Units per Second?)
This means, if nothing else is running, It would be consuming 70/5000*100=1.4% of the provisioned capacity.
Now, If I look at the Insights screen in Azure portal under CosmosDb, it shows a chart "Normalized RU Consumption (max)' . This chart shows that I'm using 40%-50% of the 5000 RU/s provisioned.
Can anyone explain this? It is almost a difference of 35 times more expensive, which must be accounted for somehow.
The total requests shows that not more requests are performed. The partitionkey is synthetic yyyy-dd-<random 0..20>. TTL is 7 days. Hence we have 20 partitions.
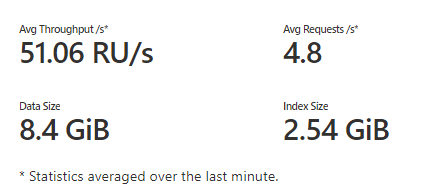
These are some metrics provided by azure for the above case. It shows a consumption 51 RU/s .... why does it need to have about 2000 RU/s provisioned in order to handle this 'not so heavy' load?
(since I did not get a response here, I habe posted the same question on stackoverflow, that version contains newly added updates ...
https://stackoverflow.com/questions/67557553/cosmosdb-requestunit-consumption-mismatch
' cx='32' cy='32' r='32' /%3E%3Ctext x='50%25' y='55%25' dominant-baseline='middle' text-anchor='middle' fill='%23FFF' %3ENS%3C/text%3E%3C/svg%3E)
@Pablo-1095 We are checking this and will get back to you.
@Pablo-1095 Looks like you have the root cause from the SO issue. Please confirm if you need any further help.
@Pablo-1095 We are posting your final comment on Stack Overflow here. All credits to Noah Stahl
Given the big difference between your expected throughput and throttling witnessed, it seems like you have some operations that are more expensive than you think, or more bursty. I'd try implementing more granular logging in the application code, e.g in this example youtu.be/Tht_RV5QPJ0?t=2964
The 'bursty' comment was the pointer to the solution. The avg numbers per minute are all OK, so there seems to be a big gap in expected usage vs required capacity provisioning. However if you look per second (by using the logs), it becomes clear that some seconds do not have any traffic, while other seconds are seeing traffic which is much higher in terms of RU's. By fixing these bursts, everything went back to 'as expected'.