Community Center | Not monitored
Tag not monitored by Microsoft.
This browser is no longer supported.
Upgrade to Microsoft Edge to take advantage of the latest features, security updates, and technical support.
' cx='32' cy='32' r='32' /%3E%3Ctext x='50%25' y='55%25' dominant-baseline='middle' text-anchor='middle' fill='%23FFF' %3ESA%3C/text%3E%3C/svg%3E)
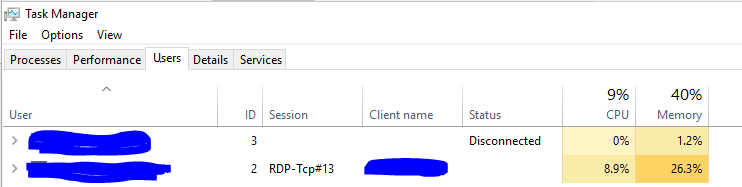
I am working on C# Application and wants to show the CPU , memory usage per user connected to one virtual machine in Azure similarly how it is reflected in Task manager (Kindly refer the snapshot), is there any way to pro grammatically determine this? I have already tried Performance Monitor class.
Thank You
' cx='32' cy='32' r='32' /%3E%3Ctext x='50%25' y='55%25' dominant-baseline='middle' text-anchor='middle' fill='%23FFF' %3EVW%3C/text%3E%3C/svg%3E)
Hi,
Thank you for posting in our forum
If your IPC is < 1.0, you are likely memory stalled, and software tuning strategies include reducing memory I/O, and improving CPU caching and memory locality, especially on NUMA systems. Hardware tuning includes using processors with larger CPU caches, and faster memory, busses, and interconnects.
If your IPC is > 1.0, you are likely instruction bound. Look for ways to reduce code execution: eliminate unnecessary work, cache operations, etc. CPU flame graphs are a great tool for this investigation. For hardware tuning, try a faster clock rate, and more cores/hyperthreads.
For my above rules, I split on an IPC of 1.0. Where did I get that from? I made it up, based on my prior work with PMCs. Here's how you can get a value that's custom for your system and runtime: write two dummy workloads, one that is CPU bound, and one memory bound. Measure their IPC, then calculate their mid point.
Every performance tool should show IPC along with %CPU. Or break down %CPU into instruction-retired cycles vs stalled cycles, eg, %INS and %STL.
As for top(1), there is tiptop(1) for Linux, which shows IPC by process:
reference:http://www.brendangregg.com/blog/2017-05-09/cpu-utilization-is-wrong.html
Hope this information can help you
Best wishes
Vicky
Hi,
Welcome to share your current situation if there are any updates.
Please feel free to let us know if you need further assistance.
Best Regards,
Vicky
Hello Vicky
Apologizes to my delayed response.
I have read the referenced article and got some idea behind that.
Main thing is I am working on Monitoring App and the customer is very keen to see CPU and memory per user logged in one VM as he sees in Taskmanager, so how the taskmanager is able to do so? Also is it possible to fetch those values either using WMI or someother way?
Thanks,
Amit Singh
Hi,
Thank you for your waiting and reply.
If you want to achieve it through WMI, then you can go to the corresponding team to post
This knowledge point is beyond the scope of ADDS.
Thank you for your understanding and support
Best wishes
Vicky
Hi,
Just checking in to see if the information provided was helpful.
Please let us know if you would like further assistance.
Best Regards,
Vicky