Azure Machine Learning
An Azure machine learning service for building and deploying models.
This browser is no longer supported.
Upgrade to Microsoft Edge to take advantage of the latest features, security updates, and technical support.
' cx='32' cy='32' r='32' /%3E%3Ctext x='50%25' y='55%25' dominant-baseline='middle' text-anchor='middle' fill='%23FFF' %3EAS%3C/text%3E%3C/svg%3E)
Next to the Normalized root mean squared error value, select View all other metrics to see values of other possible evaluation metrics for a regression model.
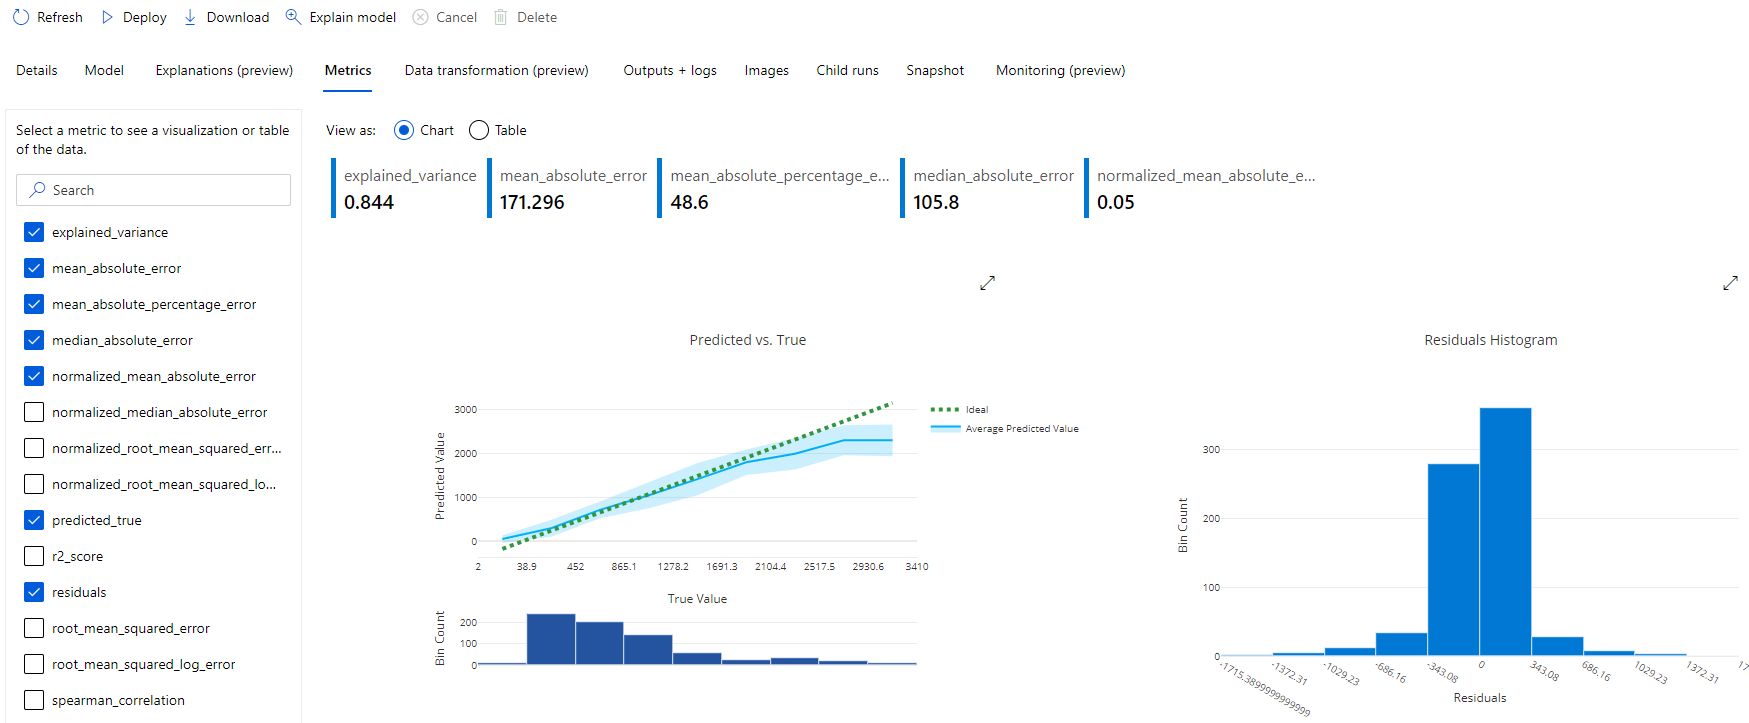
Select the Metrics tab and select the residuals and predicted_true charts if they are not already selected. Then review the charts, which show the performance of the model by comparing the predicted values against the true values, and by showing the residuals (differences between predicted and actual values) as a histogram.
As per the above lines, I am not able to find the Metrics tab and not able to see the predicted true charts.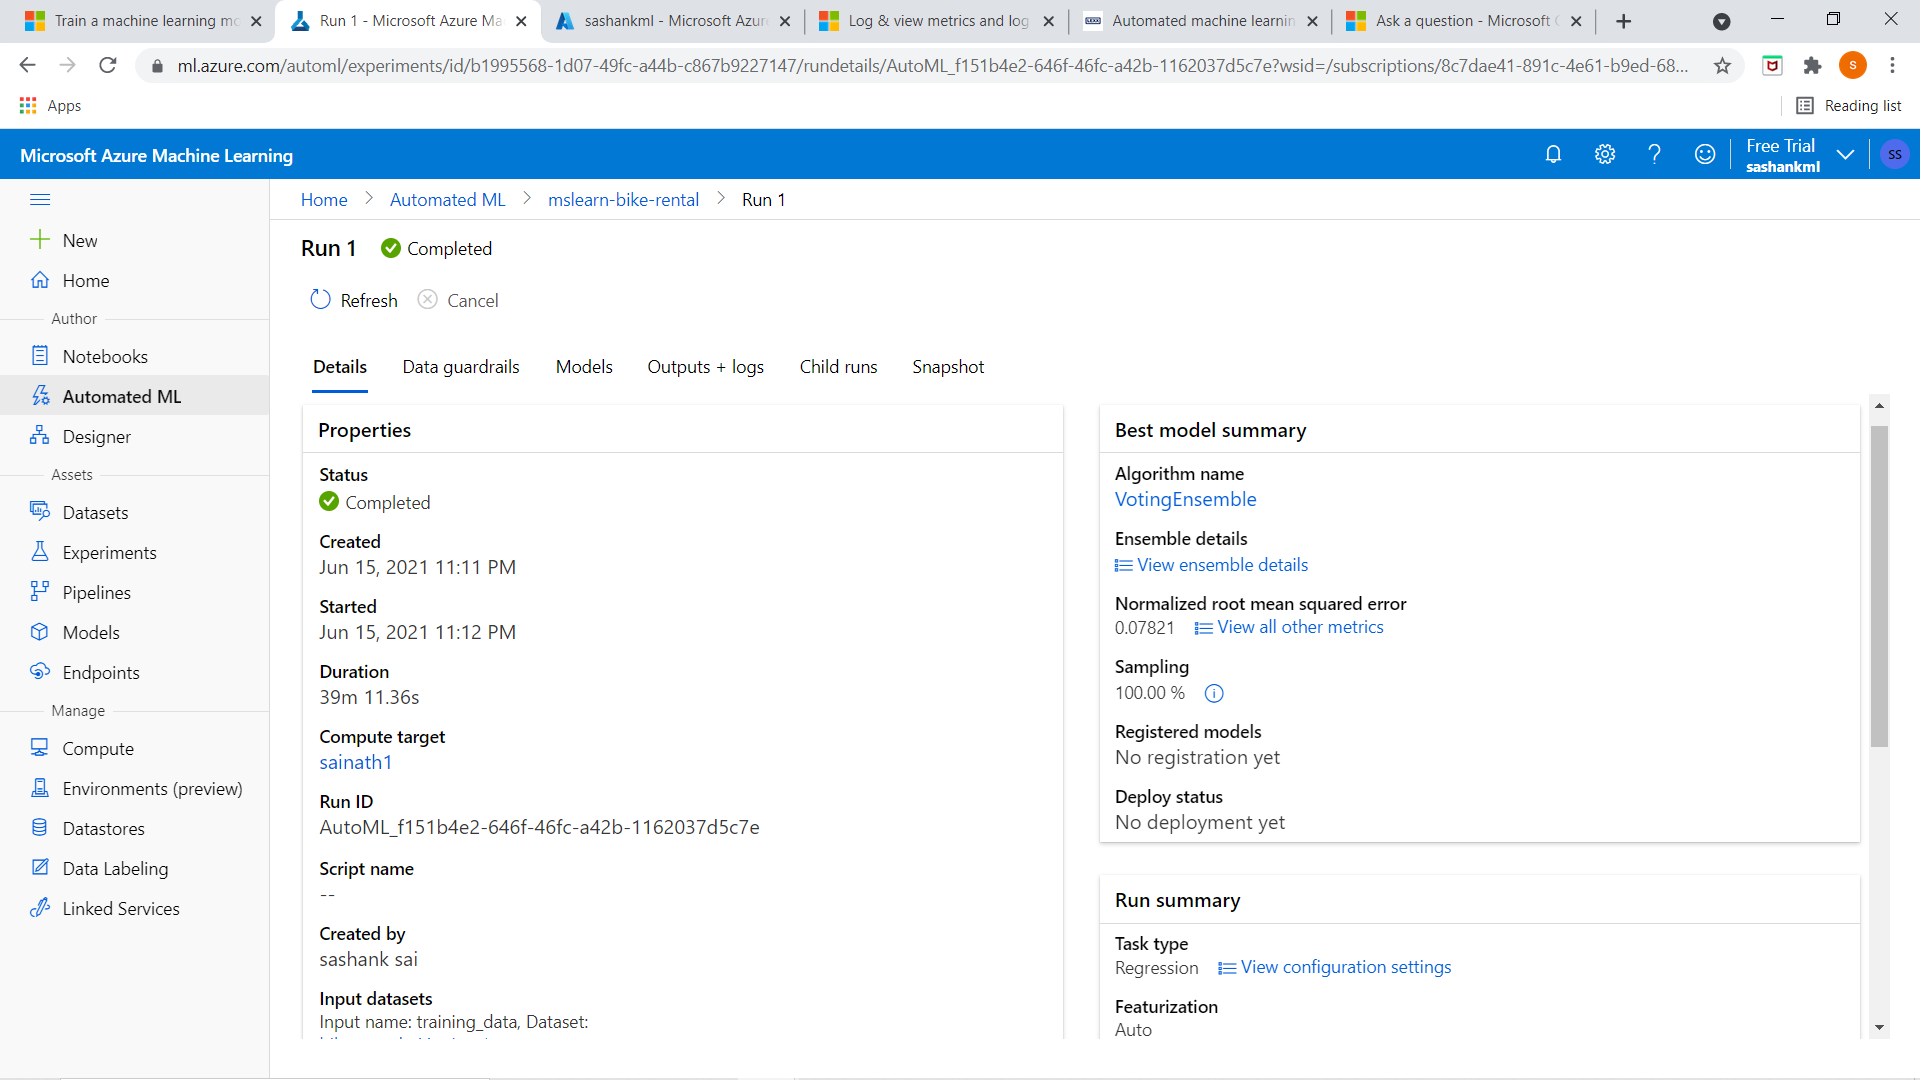

@A Sashank Sainath Reddy You will have to first click on the algorithm name from the screen shot first.
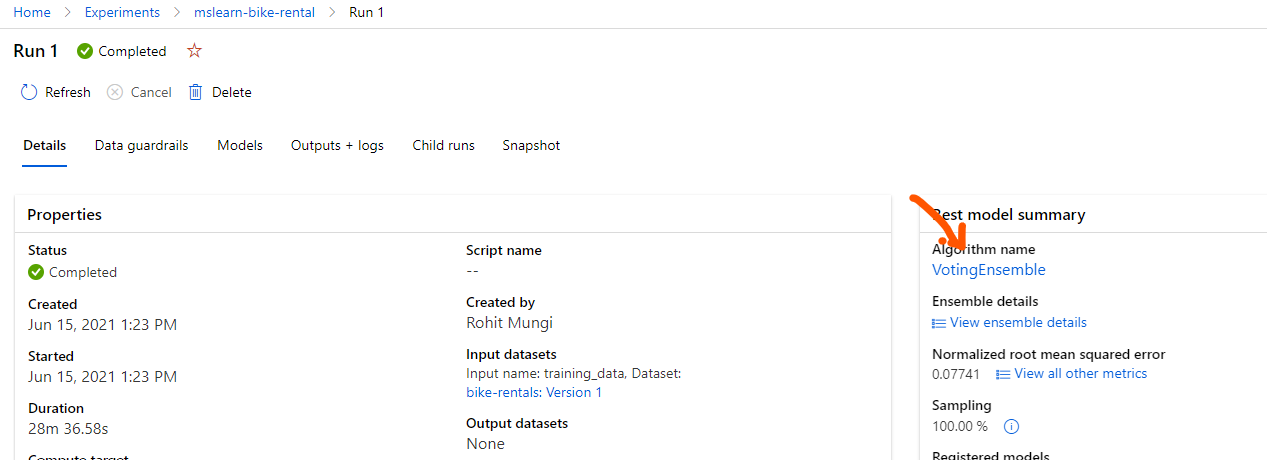
Then you will see the metrics tab and the charts.
Please feel free to accept the answer if it helped. Thanks.