VS Performance Profiler - Memory Usage snapshot contain only ~20% of total Private Bytes memory

Peter 96 Reputation points
2021-06-24T17:41:23.673+00:00

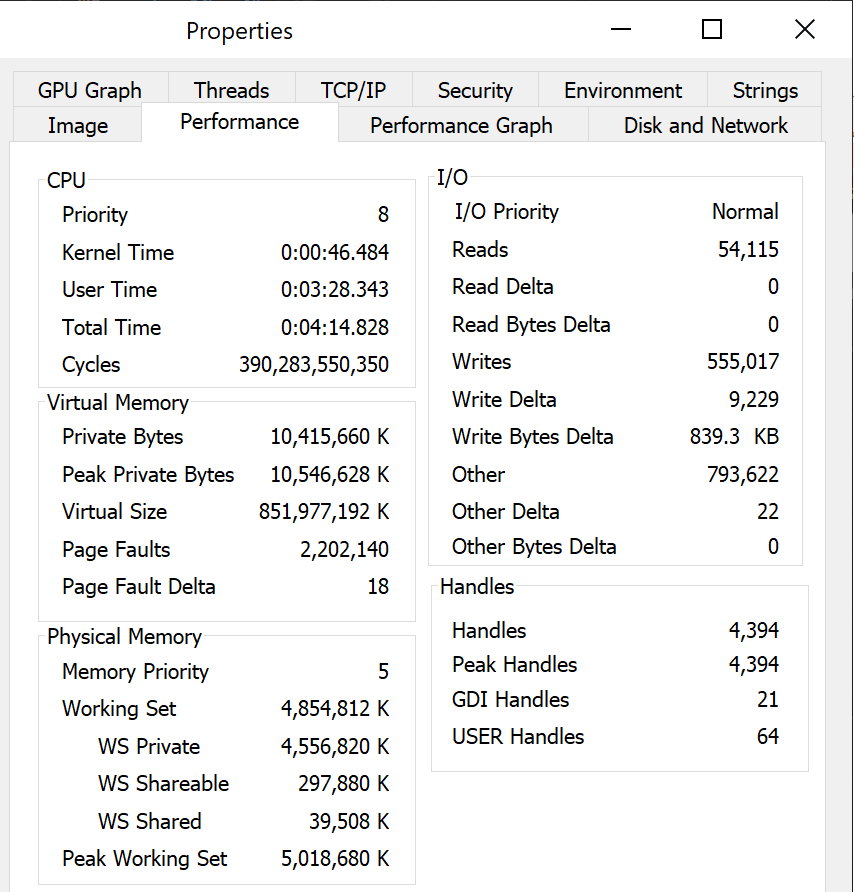
I'm analyzing memory overhead of my C++ application. I collected a Memory Usage snapshot using Visual Studio 2019 Performance Profiler. However the snapshots contain only ~20% of memory of what is reported as Private Bytes in Diagnostics tab (or Process Explorer app).

I suspect some of the unaccounted memory is stack based memory which the heap captures wouldn't cover but I'd expect its size to be miniscule amount in comparison to heap right? The system has plenty of free RAM left (100+ GB), so I don't expect 80% of Private Bytes being in pagefile, in case the Memory Usage snapshot wouldn't capture that? Any suggestions how to understand where all the memory is (i.e. how much of it is stack based memory, etc) and or how to get a capture of it all with corresponding stacks?

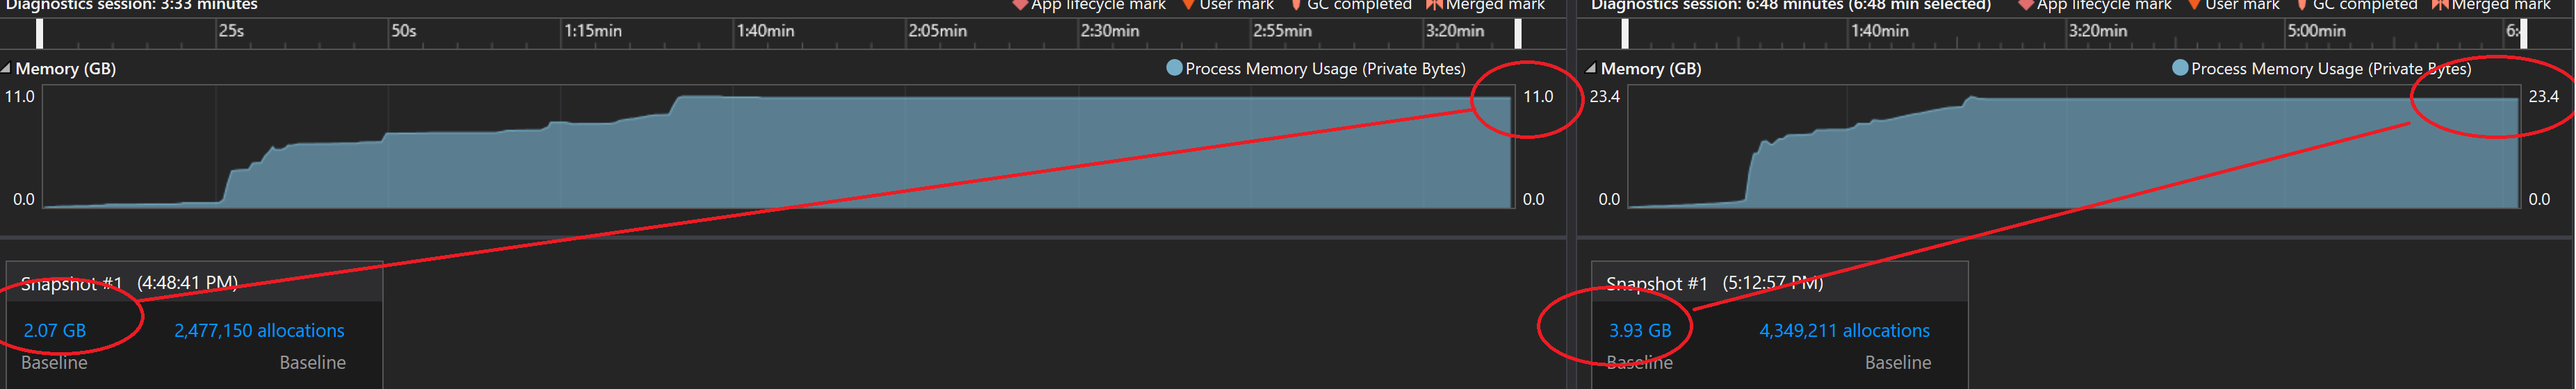
For example I collected two snapshot of my app with two different memory usage amounts:

  1. Diagnostics tab shows 11 GB taken, Memory Usage snapshot contains only 2.07 GB
  2. Diagnostics tab shows 23.4 GB taken, Memory Usage snapshot contains only 3.93 GB

Left (1), Right (2)
109409-image.png

Developer technologies | Visual Studio | Other
0 comments No comments
{count} votes

Accepted answer
  1. Peter 96 Reputation points
    2021-06-25T23:24:09.51+00:00

    Windows Performance Recorder trace with Heap + VirtualAlloc option gives a trace with stacks for all the memory and solves my issue. I haven't found an explanation why VS Performance Profiler Memory Usage is missing 80% of data, but maybe something to fix in VS traces or at least give an option to do the same as WPR provides?

    Snapshot of etl trace from WPR with all the memory associated with a stack
    109478-image.png

    0 comments No comments

3 additional answers

Sort by: Most helpful
  1. Tianyu Sun-MSFT 34,441 Reputation points Microsoft External Staff
    2021-06-25T06:29:41.677+00:00

    Hi @Peter ,

    Welcome to Microsoft Q&A forum.

    Please kindly refer to this similar thread: Snapshot memory vs process memory.

    The Process Memory is the memory consumption of your entire project. When the project start debugging, besides the code, it also invoke other tools in VS. All of them will consume memory.

    The Snapshot memory used to help us check the specific objects that consume a large number of memory … It could help us filter the view to see what changed between the two in terms of objects and heap size. In other words, Snapshot memory only collect the Object that used in your code objects.

    Other related documents for you to refer to:

    Monitor memory use

    Memory Usage snapshots

    Best Regards,
    Tianyu

    • If the answer is helpful, please click "Accept Answer" and upvote it.
      Note: Please follow the steps in our documentation to enable e-mail notifications if you want to receive the related email notification for this thread.

  2. Peter 96 Reputation points
    2021-06-25T14:23:02.96+00:00

    Thank you for sharing the links. However, it doesn't explain the missing memory in the snapshot in my case. I see similar Private Bytes numbers for the application even through Process Explorer (as pointed out in my original post) and running the app from a cmdline and not under VS debugger, so the memory not captured is not VS overhead. Well at least not the major part of it (i.e. unnacounted 9 GB in the 2 GB snapshot vs 11 GB Private Bytes of the app).

    Here's a process explorer view for the 11 GB scenario captured above
    109406-image.png

    0 comments No comments

  3. Peter 96 Reputation points
    2021-06-25T14:39:40.413+00:00

    Looking at properties of the process in Process Explorer the Working Set Private numbers are closer to what the snapshot captured, but still quite a bit far off. 4.3GB vs 2 GB

    Disabling page-file gets WS Private #s jump to Private Bytes #s during capture, but the capture itself is still as it was before. That is good it doesn't affect the capture.

    109443-image.png

    0 comments No comments

Your answer

Answers can be marked as Accepted Answers by the question author, which helps users to know the answer solved the author's problem.