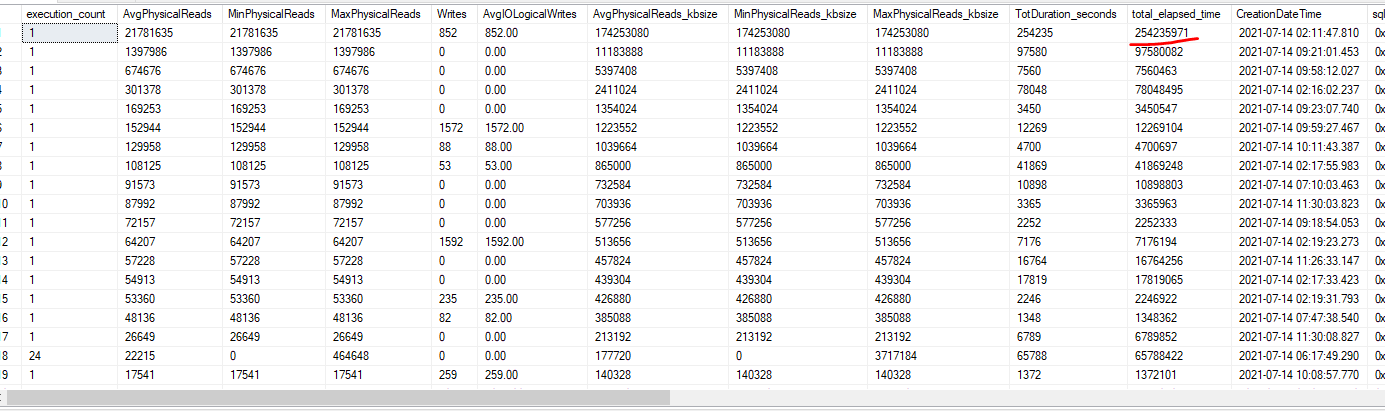
I am looking to have sql time take to run the sql in one go. How ever sys.dm_exec_query_stat , total_elapsed_time looks that it is a aggregation figures of same sql timing which run in the history. AS per the image attached total_elapsed_time is 254235971 mean a lot. When I run the sql manually I can see that run around 20 min.
AS far as no session number can get it from sys.dm_exec_query_stat, the outcome of the timing is looks aggregated? any way of getting same SQL with time duration to run
++++++++++++++++++++++++
SELECT TOP 50
qs.execution_count,
AvgPhysicalReads = isnull( qs.total_physical_reads/ qs.execution_count, 0 ),
MinPhysicalReads = qs.min_physical_reads,
MaxPhysicalReads = qs.max_physical_reads,
total_logical_writes as [Writes],
convert(money, total_logical_writes/(execution_count + 0.0)) as [AvgIOLogicalWrites],
AvgPhysicalReads_kbsize = isnull( qs.total_physical_reads/ qs.execution_count, 0 ) *8,
MinPhysicalReads_kbsize = qs.min_physical_reads*8,
MaxPhysicalReads_kbsize = qs.max_physical_reads*8,qs.total_elapsed_time/1000 as TotDuration_seconds,qs.total_elapsed_time,
CreationDateTime = qs.creation_time,
[sql_handle],
plan_handle,
SUBSTRING(qt.[text], qs.statement_start_offset/2, (
CASE
WHEN qs.statement_end_offset = -1 THEN LEN(CONVERT(NVARCHAR(MAX), qt.[text])) * 2
ELSE qs.statement_end_offset
END - qs.statement_start_offset)/2
) AS query_text,
tp.query_plan,
qt.[dbid],
qt.objectid,object_schema_name(qt.objectid, qt.dbid)+'.'+object_name(qt.objectid, qt.dbid) as [object_name],
tp.query_plan.exist('declare default element namespace "http://schemas.microsoft.com/sqlserver/2004/07/showplan";
/ShowPlanXML/BatchSequence/Batch/Statements/StmtSimple/QueryPlan/MissingIndexes') missing_index_info
FROM
sys.dm_exec_query_stats qs
CROSS APPLY sys.dm_exec_sql_text (qs.[sql_handle]) AS qt
--CROSS APPLY sys.dm_exec_sessions (r.sql_handle) AS st
OUTER APPLY sys.dm_exec_query_plan(qs.plan_handle) tp
ORDER BY AvgPhysicalReads DESC
+++++++++++++++++++++++++
' cx='32' cy='32' r='32' /%3E%3Ctext x='50%25' y='55%25' dominant-baseline='middle' text-anchor='middle' fill='%23FFF' %3EA%3C/text%3E%3C/svg%3E)
' cx='32' cy='32' r='32' /%3E%3Ctext x='50%25' y='55%25' dominant-baseline='middle' text-anchor='middle' fill='%23FFF' %3ECZ%3C/text%3E%3C/svg%3E)
