SQL Server Reporting Services
A SQL Server technology that supports the creation, management, and delivery of both traditional, paper-oriented reports and interactive, web-based reports.
3,067 questions
This browser is no longer supported.
Upgrade to Microsoft Edge to take advantage of the latest features, security updates, and technical support.
' cx='32' cy='32' r='32' /%3E%3Ctext x='50%25' y='55%25' dominant-baseline='middle' text-anchor='middle' fill='%23FFF' %3EMG%3C/text%3E%3C/svg%3E)
I need to create a gauge that looks like this:
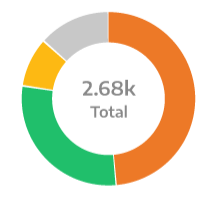
Any idea how to add actual data to it? I have one row with 4 columns with numeric values. I want it act as a donut chart but wuth text in the center.
Thanks
' cx='32' cy='32' r='32' /%3E%3Ctext x='50%25' y='55%25' dominant-baseline='middle' text-anchor='middle' fill='%23FFF' %3ES%3C/text%3E%3C/svg%3E)
Hi Mark,
Did you find a way to add total inside the Donut chart? If yes, could you please how you did it.
Joy,
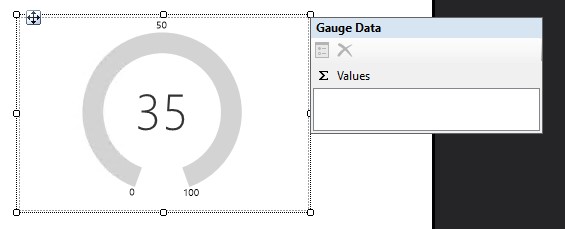
I am bit unsure, how to add category field to the gauge chart to show part of a whole data
Thanks,
Saranya
' cx='32' cy='32' r='32' /%3E%3Ctext x='50%25' y='55%25' dominant-baseline='middle' text-anchor='middle' fill='%23FFF' %3EZ%3C/text%3E%3C/svg%3E)
Did the accepted answer work for you?
Hi @Joyzhao-MSFT ,
Could you please let me know how to add category groups to the gauge chart like how you add to the example you have given in 2021?
I want to know how to add category group to the gauge chart to display part of a whole data.
Thanks,
Saranya

Hi @mark goldin ,
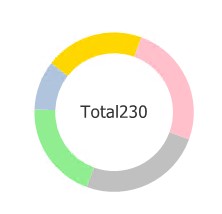
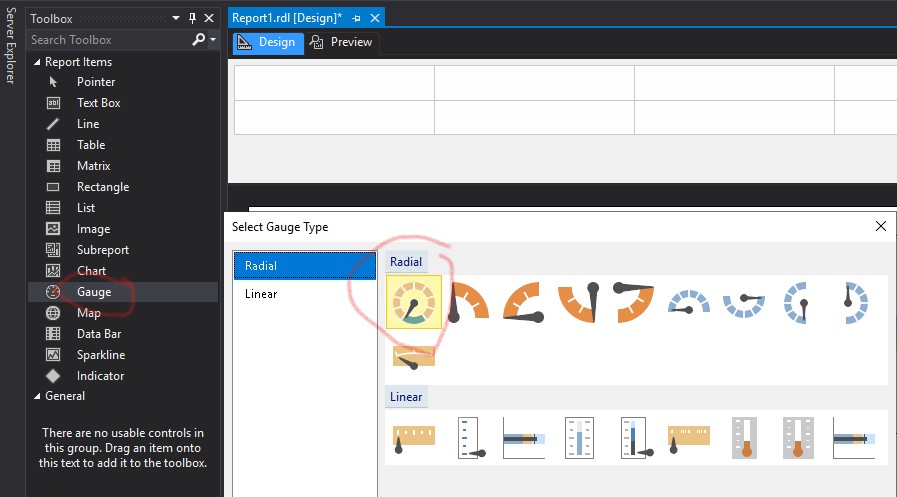
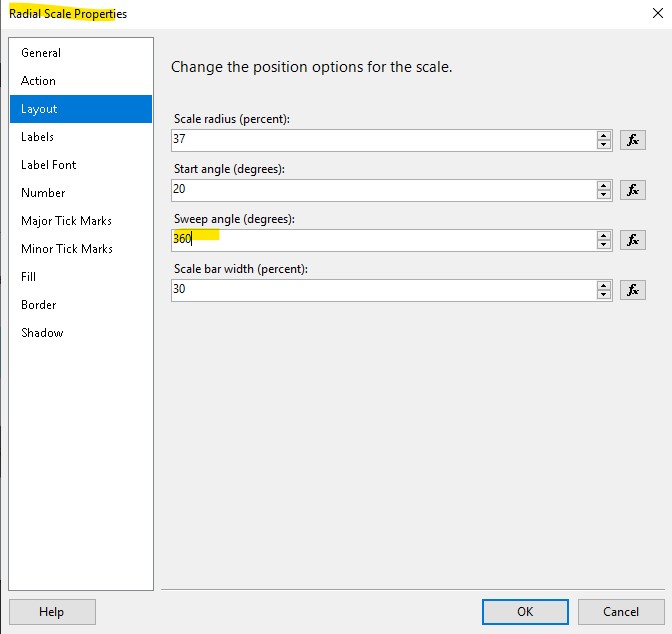
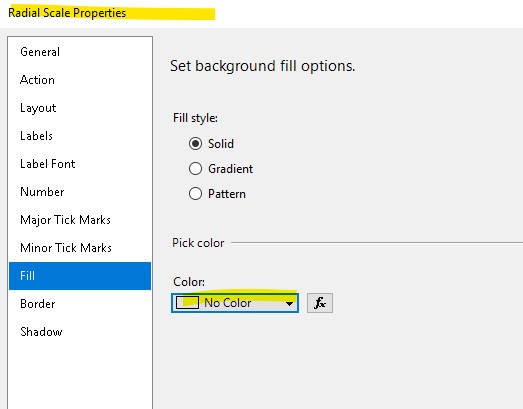
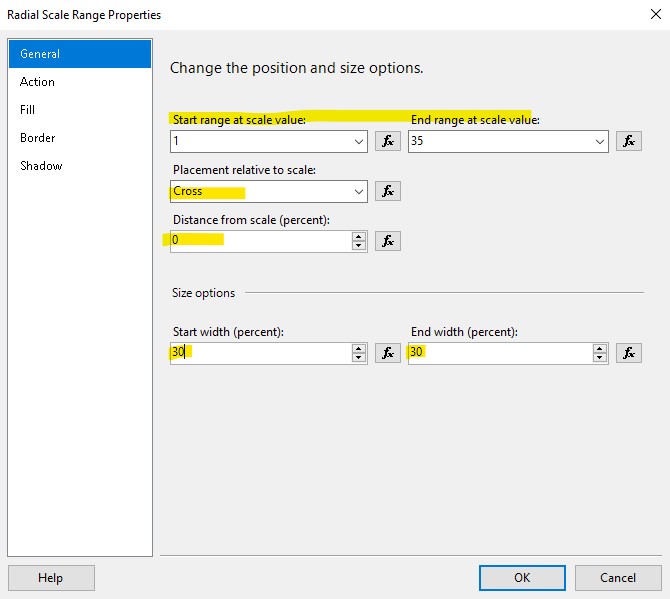
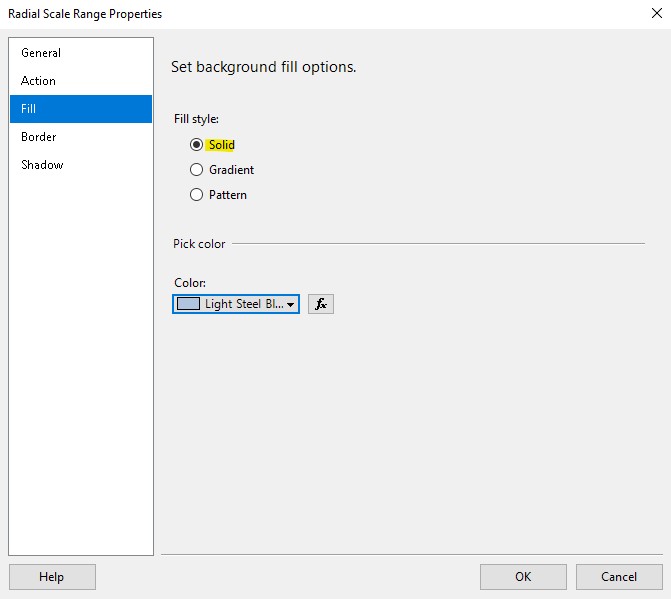
I did some test. If you need to add a total label to the doughnut, you need to create a Gauge instead of a Doughnut chart. Because Doughnut does not support adding a text box in the middle of the chart.
Below is the donut I created using Gauge.
Best Regards,
Joy
If the answer is helpful, please click "Accept Answer" and upvote it.
Note: Please follow the steps in our documentation to enable e-mail notifications if you want to receive the related email notification for this thread.