' cx='32' cy='32' r='32' /%3E%3Ctext x='50%25' y='55%25' dominant-baseline='middle' text-anchor='middle' fill='%23FFF' %3ETD%3C/text%3E%3C/svg%3E)
46,185 questions

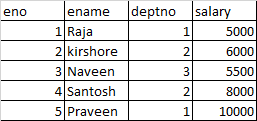
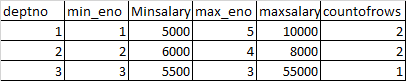
In this Excel workbook 4 DAX Measures to get what you want:
Min_Eno
=CALCULATE (
    MIN ( Table1[eno] );
    FILTER ( Table1; Table1[salary] = MIN ( Table1[salary] ) )
)
Min_Salary
=CALCULATE (
    MIN ( Table1[salary] );
    FILTER ( Table1; Table1[salary] = MIN ( Table1[salary] ) )
)
Max_Salary
=CALCULATE (
    MAX ( Table1[salary] );
    FILTER ( Table1; Table1[salary] = MAX ( Table1[salary] ) )
)
Count_Rows
=COUNTROWS(Table1)
Note: IMHO Min_Eno makes no sense at all from a business point of view. If, for the same [deptno], 2 (or more) Min_Salary equal - see my example with [deptno] = 2 - what's the point?