Developer technologies | .NET | Xamarin
A Microsoft framework for building cross-platform mobile apps using .NET and C# with native performance and user interfaces.
This browser is no longer supported.
Upgrade to Microsoft Edge to take advantage of the latest features, security updates, and technical support.

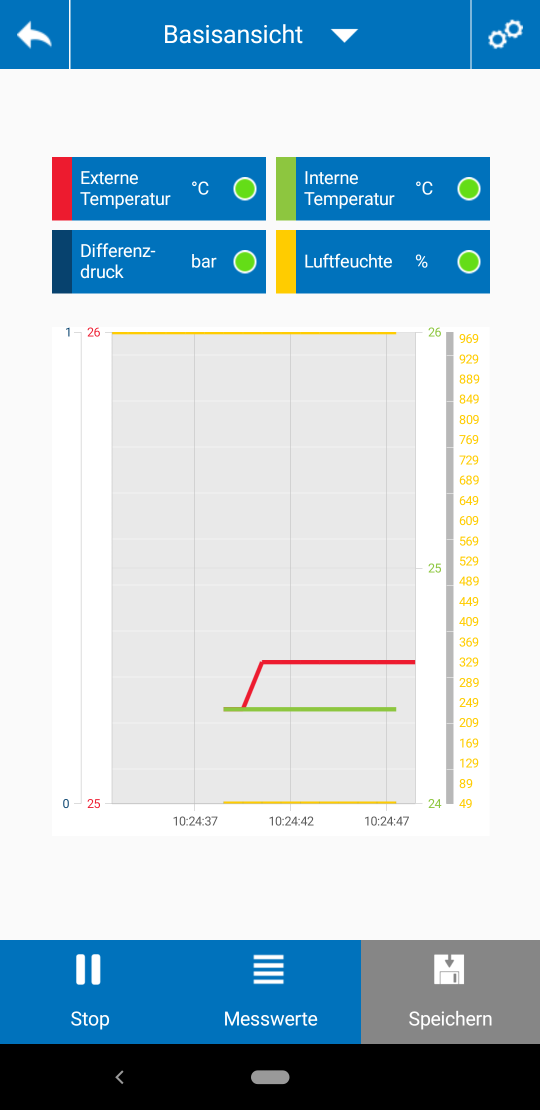
recently, we have discovered an error in my Xamarin.Forms application that seems to be in correlation to the Syncfusion element 'SfChart'.
We have a 4-axis chart that fetches data via data binding. The error occurs when one object that carries the data, used by the chart to draw the lines, is getting removed, added or altered.
This data is stored in an ObservableCollection and signals a PropertyChanged when altered.
Whenever a different data object is assigned to an index of the data list, bound to the ItemSources of the individual FastLineSeries, I sometimes get the following error:
[mono-rt] [ERROR] FATAL UNHANDLED EXCEPTION: System.ArgumentOutOfRangeException: Index must be within the bounds of the List.
[mono-rt] Parameter name: index
[mono-rt] at System.Collections.Generic.List`1[T].Insert (System.Int32 index, T item) [0x00009] in /Users/builder/jenkins/workspace/archive-mono/2020-02/android/release/external/corefx/src/Common/src/CoreLib/System/Collections/Generic/List.cs:688
[mono-rt] at Com.Syncfusion.Charts.ChartSeries.SetIndividualPoint (System.Int32 index, System.Object value, System.Boolean replace) [0x007d4] in <5223039dbed24acb9c9c1764d59d17de>:0
[mono-rt] at Com.Syncfusion.Charts.ChartSeries.OnDataSource_CollectionChanged (System.Object sender, System.Collections.Specialized.NotifyCollectionChangedEventArgs e) [0x00041] in <5223039dbed24acb9c9c1764d59d17de>:0
[mono-rt] at (wrapper delegate-invoke) <Module>.invoke_void_object_NotifyCollectionChangedEventArgs(object,System.Collections.Specialized.NotifyCollectionChangedEventArgs)
[mono-rt] at System.Collections.ObjectModel.ObservableCollection`1[T].OnCollectionChanged (System.Collections.Specialized.NotifyCollectionChangedEventArgs e) [0x00018] in /Users/builder/jenkins/workspace/archive-mono/2020-02/android/release/external/corefx/src/System.ObjectModel/src/System/Collections/ObjectModel/ObservableCollection.cs:263
[mono-rt] at MvvmCross.ViewModels.MvxObservableCollection`1[T].<>n__0 (System.Collections.Specialized.NotifyCollectionChangedEventArgs e) <0x727c3f6d68 + 0x00043> in <687f2e5f7efd4e33b498a18ba9db221f>:0
[mono-rt] at MvvmCross.ViewModels.MvxObservableCollection`1+<>c__DisplayClass7_0[T].<OnCollectionChanged>b__0 () [0x00000] in /_/MvvmCross/ViewModels/MvxObservableCollection.cs:72
[mono-rt] at MvvmCross.Base.MvxMainThreadAsyncDispatcher+<>c__DisplayClass0_0.<ExecuteOnMainThreadAsync>b__0 () [0x00000] in /_/MvvmCross/Base/MvxMainThreadAsyncDispatcher.cs:16
[mono-rt] at MvvmCross.Base.MvxMainThreadAsyncDispatcher+<>c__DisplayClass1_0.<ExecuteOnMainThreadAsync>b__0 () [0x00011] in /_/MvvmCross/Base/MvxMainThreadAsyncDispatcher.cs:27
[mono-rt] at (wrapper dynamic-method) Android.Runtime.DynamicMethodNameCounter.26(intptr,intptr)
[mono-rt] at (wrapper native-to-managed) Android.Runtime.DynamicMethodNameCounter.26(intptr,intptr)
It also seems that sometimes after changing or deleting the data for the LineSeries, old data is retained in the UI element and two of the same LineSeries with the same color gets drawn, even if this data isn't anywhere in the data bound list.
What's weird is that two lines with the same color and a big value difference get drawn by the chart, although there only is one possible binding that one LineSeries should be able to get data from.
Best regards
The XAML looks like this:
<Grid
Grid.Row="0"
Grid.Column="0"
BackgroundColor="#0072BC"
HorizontalOptions="FillAndExpand"
VerticalOptions="FillAndExpand">
<Grid.ColumnDefinitions>
<ColumnDefinition Width="*" />
<ColumnDefinition Width="*" />
<ColumnDefinition Width="*" />
<ColumnDefinition Width="*" />
<ColumnDefinition Width="*" />
<ColumnDefinition Width="*" />
<ColumnDefinition Width="*" />
<ColumnDefinition Width="*" />
</Grid.ColumnDefinitions>
<Grid.GestureRecognizers>
<TapGestureRecognizer Command="{Binding TapChartSelectionPopup}" CommandParameter="0" />
</Grid.GestureRecognizers>
<Label
Grid.Column="0"
BackgroundColor="#ED1B2F"
HorizontalOptions="FillAndExpand" />
<Label
Grid.Column="1"
Grid.ColumnSpan="4"
HorizontalOptions="Start"
Text="{Binding PanelAppModel.PanelApp.ChartModel.ChartDataList[0].Name}" />
<Label
x:Name="UnitLabel1"
Grid.Column="5"
Grid.ColumnSpan="2"
HorizontalOptions="FillAndExpand"
Text="{Binding PanelAppModel.PanelApp.ChartModel.ChartDataList[0].Unit}"
TextColor="White"
VerticalOptions="FillAndExpand" />
<Image
Grid.Column="6"
Grid.ColumnSpan="2"
Margin="0,0,-5,0"
HorizontalOptions="Center"
Scale="0.7"
Source="{Binding PanelAppModel.PanelApp.ChartModel.ChartDataList[0].ImagePath}" />
</Grid>
<Grid
Grid.Row="0"
Grid.Column="1"
BackgroundColor="#0072BC"
HorizontalOptions="FillAndExpand"
VerticalOptions="FillAndExpand">
<Grid.ColumnDefinitions>
<ColumnDefinition Width="*" />
<ColumnDefinition Width="*" />
<ColumnDefinition Width="*" />
<ColumnDefinition Width="*" />
<ColumnDefinition Width="*" />
<ColumnDefinition Width="*" />
<ColumnDefinition Width="*" />
<ColumnDefinition Width="*" />
</Grid.ColumnDefinitions>
<Grid.GestureRecognizers>
<TapGestureRecognizer Command="{Binding TapChartSelectionPopup}" CommandParameter="1" />
</Grid.GestureRecognizers>
<Label
Grid.Column="0"
BackgroundColor="#8DC63F"
HorizontalOptions="FillAndExpand" />
<Label
Grid.Column="1"
Grid.ColumnSpan="4"
HorizontalOptions="Start"
Text="{Binding PanelAppModel.PanelApp.ChartModel.ChartDataList[1].Name}" />
<Label
x:Name="UnitLabel2"
Grid.Column="5"
Grid.ColumnSpan="2"
HorizontalOptions="FillAndExpand"
Text="{Binding PanelAppModel.PanelApp.ChartModel.ChartDataList[1].Unit}"
TextColor="White"
VerticalOptions="FillAndExpand" />
<Image
Grid.Column="6"
Grid.ColumnSpan="2"
Margin="0,0,-5,0"
HorizontalOptions="Center"
Scale="0.7"
Source="{Binding PanelAppModel.PanelApp.ChartModel.ChartDataList[1].ImagePath}" />
</Grid>
<Grid
Grid.Row="1"
Grid.Column="0"
BackgroundColor="#0072BC"
HorizontalOptions="FillAndExpand"
VerticalOptions="FillAndExpand">
<Grid.ColumnDefinitions>
<ColumnDefinition Width="*" />
<ColumnDefinition Width="*" />
<ColumnDefinition Width="*" />
<ColumnDefinition Width="*" />
<ColumnDefinition Width="*" />
<ColumnDefinition Width="*" />
<ColumnDefinition Width="*" />
<ColumnDefinition Width="*" />
</Grid.ColumnDefinitions>
<Grid.GestureRecognizers>
<TapGestureRecognizer Command="{Binding TapChartSelectionPopup}" CommandParameter="2" />
</Grid.GestureRecognizers>
<Label
Grid.Column="0"
BackgroundColor="#07426E"
HorizontalOptions="FillAndExpand" />
<Label
Grid.Column="1"
Grid.ColumnSpan="4"
HorizontalOptions="Start"
Text="{Binding PanelAppModel.PanelApp.ChartModel.ChartDataList[2].Name}" />
<Label
x:Name="UnitLabel3"
Grid.Column="5"
Grid.ColumnSpan="2"
HorizontalOptions="FillAndExpand"
Text="{Binding PanelAppModel.PanelApp.ChartModel.ChartDataList[2].Unit}"
TextColor="White"
VerticalOptions="FillAndExpand" />
<Image
Grid.Column="6"
Grid.ColumnSpan="2"
Margin="0,0,-5,0"
HorizontalOptions="Center"
Scale="0.7"
Source="{Binding PanelAppModel.PanelApp.ChartModel.ChartDataList[2].ImagePath}" />
</Grid>
<Grid
Grid.Row="1"
Grid.Column="1"
BackgroundColor="#0072BC"
HorizontalOptions="FillAndExpand"
VerticalOptions="FillAndExpand">
<Grid.ColumnDefinitions>
<ColumnDefinition Width="*" />
<ColumnDefinition Width="*" />
<ColumnDefinition Width="*" />
<ColumnDefinition Width="*" />
<ColumnDefinition Width="*" />
<ColumnDefinition Width="*" />
<ColumnDefinition Width="*" />
<ColumnDefinition Width="*" />
</Grid.ColumnDefinitions>
<Grid.GestureRecognizers>
<TapGestureRecognizer Command="{Binding TapChartSelectionPopup}" CommandParameter="3" />
</Grid.GestureRecognizers>
<Label
Grid.Column="0"
BackgroundColor="#FFCC00"
HorizontalOptions="FillAndExpand" />
<Label
Grid.Column="1"
Grid.ColumnSpan="4"
HorizontalOptions="Start"
Text="{Binding PanelAppModel.PanelApp.ChartModel.ChartDataList[3].Name}" />
<Label
x:Name="UnitLabel4"
Grid.Column="5"
Grid.ColumnSpan="2"
HorizontalOptions="FillAndExpand"
Text="{Binding PanelAppModel.PanelApp.ChartModel.ChartDataList[3].Unit}"
TextColor="White"
VerticalOptions="FillAndExpand" />
<Image
Grid.Column="6"
Grid.ColumnSpan="2"
Margin="0,0,-5,0"
HorizontalOptions="Center"
Scale="0.7"
Source="{Binding PanelAppModel.PanelApp.ChartModel.ChartDataList[3].ImagePath}" />
</Grid>
</Grid>
</StackLayout>
<StackLayout
HorizontalOptions="FillAndExpand"
Orientation="Horizontal"
RelativeLayout.HeightConstraint="{ConstraintExpression Type=RelativeToParent,
Property=Height,
Factor=0.75}"
RelativeLayout.WidthConstraint="{ConstraintExpression Type=RelativeToParent,
Property=Width,
Factor=0.9}"
RelativeLayout.XConstraint="{ConstraintExpression Type=RelativeToParent,
Property=Width,
Factor=0.05}"
RelativeLayout.YConstraint="{ConstraintExpression Type=RelativeToParent,
Property=Height,
Factor=0.25}"
VerticalOptions="FillAndExpand">
<sfChart:SfChart
x:Name="chart"
HorizontalOptions="FillAndExpand"
VerticalOptions="FillAndExpand">
<sfChart:SfChart.PrimaryAxis>
<sfChart:DateTimeAxis />
</sfChart:SfChart.PrimaryAxis>
<sfChart:SfChart.ChartBehaviors>
<sfChart:ChartZoomPanBehavior EnableDirectionalZooming="True" EnableDoubleTap="True" />
</sfChart:SfChart.ChartBehaviors>
<sfChart:SfChart.Series>
<sfChart:FastLineSeries
x:Name="flSeries1"
ItemsSource="{Binding PanelAppModel.PanelApp.ChartModel.ChartDataList[0].ChartDataLog}"
XBindingPath="TestDT"
YBindingPath="Value"
Color="#ED1B2F" />
<sfChart:FastLineSeries
x:Name="flSeries2"
ItemsSource="{Binding PanelAppModel.PanelApp.ChartModel.ChartDataList[1].ChartDataLog}"
XBindingPath="TestDT"
YBindingPath="Value"
Color="#8DC63F" />
<sfChart:FastLineSeries
x:Name="flSeries3"
ItemsSource="{Binding PanelAppModel.PanelApp.ChartModel.ChartDataList[2].ChartDataLog}"
XBindingPath="TestDT"
YBindingPath="Value"
Color="#07426E" />
<sfChart:FastLineSeries
x:Name="flSeries4"
ItemsSource="{Binding PanelAppModel.PanelApp.ChartModel.ChartDataList[3].ChartDataLog}"
XBindingPath="TestDT"
YBindingPath="Value"
Color="#FFCC00" />
</sfChart:SfChart.Series>
</sfChart:SfChart>
</StackLayout>
' cx='32' cy='32' r='32' /%3E%3Ctext x='50%25' y='55%25' dominant-baseline='middle' text-anchor='middle' fill='%23FFF' %3EA%3C/text%3E%3C/svg%3E)
You can open an issue in the syncfusion's forum https://www.syncfusion.com/forums/xamarin.forms