Azure SQL Database Fit Query

John Couch 181 Reputation points
2021-07-30T01:11:44.637+00:00

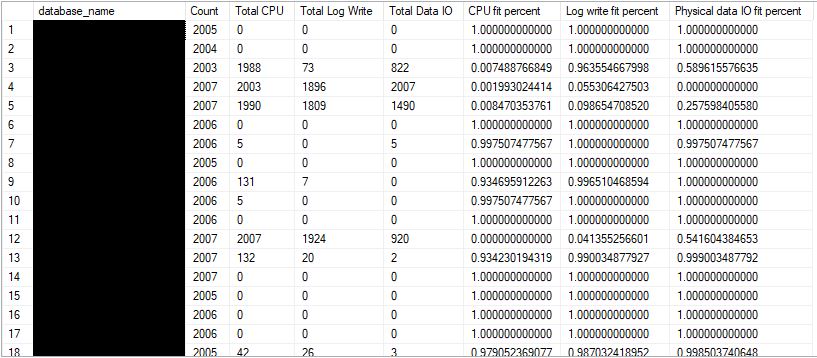
I don't understand this query result. According to the documentation, if this query returns anything < 99.9% you should consider moving to the next highest compute size. The problem I have is that this seems backwards. I know my tier is barely utilized, but this says 0.99% for 2 of the categories. According tot he statement I should move up, but I feel like that should mean I could move down.

SELECT  
    (COUNT(database_name) - SUM(CASE WHEN avg_cpu_percent >= 100 THEN 1 ELSE 0 END) * 1.0) / COUNT(database_name) AS 'CPU fit percent'  
    ,(COUNT(database_name) - SUM(CASE WHEN avg_log_write_percent >= 100 THEN 1 ELSE 0 END) * 1.0) / COUNT(database_name) AS 'Log write fit percent'  
    ,(COUNT(database_name) - SUM(CASE WHEN avg_data_io_percent >= 100 THEN 1 ELSE 0 END) * 1.0) / COUNT(database_name) AS 'Physical data IO fit percent'  
    FROM sys.resource_stats  
    WHERE database_name = 'userdb1' AND start_time > DATEADD(day, -7, GETDATE());  

https://github.com/MicrosoftDocs/azure-docs/blob/master/articles/azure-sql/database/monitoring-with-dmvs.md

Scroll to near the bottom.

As an example, I have the following values...see attached.119232-output.jpg

Shouldn't these formulas be multiplied by 100?

Azure SQL Database
{count} votes

1 answer

Sort by: Most helpful
  1. Oury Ba-MSFT 19,581 Reputation points Microsoft Employee
    2021-08-04T21:22:23.283+00:00

    Hi @John Couch
    The intent of the query is to return a percentage of the time the workload “fit” inside the current resource limit. For example, a result of 1.000000000000 1.000000000000 1.000000000000 indicates that the workload always fit underneath the desired % of the resource limit. Any result less than 1 (or less than 99.9%) indicates that in the five-minute samples that sys.resources_stats, the workload exceeded the desired target of <100% of the resource limit.

    Try changing the numbers from “>= 100” to “>= 50”, to understand when resources exceeded 50% of the resource limit). Or change the numbers to >= 5 (to view when the resources exceed 5% of the resource limit), to easily understand how often the workload “fits” based on the current resource limit.

    Note that sys.resource_stats also includes dtu_limit and some other columns to tell you what the resource limit was for that sample.

    Let me know if that helps.

    Regards,
    Oury

Your answer

Answers can be marked as Accepted Answers by the question author, which helps users to know the answer solved the author's problem.