Microsoft 365 and Office | Access | For home | Windows
A family of Microsoft relational database management systems designed for ease of use.
This browser is no longer supported.
Upgrade to Microsoft Edge to take advantage of the latest features, security updates, and technical support.
' cx='32' cy='32' r='32' /%3E%3Ctext x='50%25' y='55%25' dominant-baseline='middle' text-anchor='middle' fill='%23FFF' %3EA%3C/text%3E%3C/svg%3E)
I would like to create a visual display of the hours worked for a group of contractors across several sites. I was thinking of creating this using a gantt but Project isn't that great for this sort of thing. I need to be able to show things like no of staff, hours start/finish each day, hourly rates etc. Any suggestions greatly appreciated! If I can use something other than project which is better for this type of thing then I would prefer to if the visuals are better :)
Locked Question. This question was migrated from the Microsoft Support Community. You can vote on whether it's helpful, but you can't add comments or replies or follow the question.
Have you considered using Excel? While there isn't a "native" GANTT chart, you can fake one a couple of ways. And excel can be used to do the other calculations you mentioned. You may be able to do some of the calculations in a PivotTable?
.
Native Excel
.
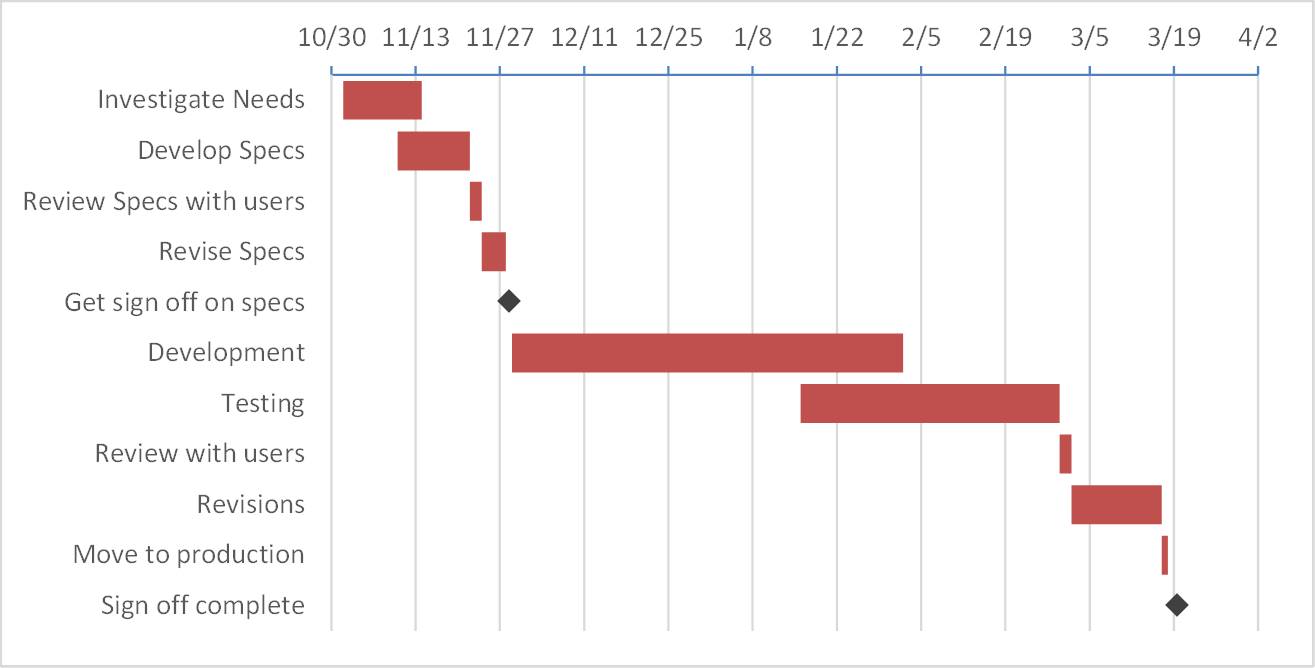
Present your data in a GANTT chart
Need to show status for a simple project schedule with a GANTT chart? Though Excel doesn’t have a predefined GANTT chart type, you can create one using this free template: GANTT project planner template for Excel
.
GANTT Chart 2013 05 22
https://www.myonlinetraininghub.com/excel-gantt-chart
Gantt charts are commonly used in project management and while Excel doesn’t have a native GANTT chart in its chart library, we can easily create one.
For fairly straight forward projects an Excel Gantt chart can be a great visual tool to understand the workflow and timing of your project.
**Conditional Formatting Gantt Chart****** 2013 05 28 Mynda Treacy
http://www.myonlinetraininghub.com/excel-conditional-formatting-gantt-chart****here it is, a Gantt Chart template using Conditional Formatting.
.
Make a GANTT chart in Excel 2010 and 2013 2014 05 23 Svetlana Cheusheva
https://www.ablebits.com/office-addins-blog/2014/05/23/make-gantt-chart-excel/
One graph type remains opaque to many users- the Gantt chart. This short tutorial will explain the key features of the Gantt diagram, show how to make a simple Gantt chart in Excel, where to download advanced Gantt chart templates and how to use the online Project Management Gantt Chart creator.
. * What is the Gantt chart?
. * How to make a Gantt chart in Excel
. * Excel Gantt chart templates
.
milestone- Creating a GANTT chart with Milestones using a Stacked Bar Chart in Excel or PowerPoint 2017 11 00
GANTT charts are not a built-in chart type in Microsoft Office (Excel, PowerPoint, and Word). There are templates you can download to create GANTT charts or add-ins you can buy. In this article I want to show you how you can create an accurate, informative GANTT chart with Milestones using a stacked bar chart in Excel (a similar method can be used to create the GANTT in PowerPoint). If you want an advanced solution with a video tutorials and sample Excel files for both monthly and daily GANTT charts, click here to jump to the bottom of the page to learn more.
https://www.thinkoutsidetheslide.com/wp-content/uploads/2017/11/GANTTInExcelWithMilestones3.jpg .
.
This series of 7 articles goes through creating GANTTs in Excel
Project Management Using Excel in 7 Parts – Chandoo 2019 10 02Part 1- Preparing & tracking a project plan using GANTT Chartshttps://chandoo.org/wp/gantt-charts-project-management/
Excel, because of its grid nature provides a great way to prepare and manage project plans. In this part of the project management using Microsoft excel series we will learn how to prepare and track a project plan using GANTT chart in excel.
Part 2- Team To Do Lists – Project Tracking Tools 2009 06 25****http://chandoo.org/wp/2009/06/25/todo-lists-project-tracking-tools/
Projects are nothing but a group of people getting together and achieving an objective – like building system or constructing a bridge. While it is important to have a overall project plan and vision, it is equally important to understand how various day to day project activities are going on. This is where to do lists can help you a lot.
Part 3: Project Status Reporting – Create a Timeline to display milestones2009 07 09
http://chandoo.org/wp/2009/07/09/project-milestones-in-timeline/
There are 2 key elements in all the successful projects I have been part of.
· They had exceptional individuals who are also exceptional team players
· The communication and collaboration is really good.
While there is little that project management software can do when it comes to first point, the second point can be addressed by using right tools and visualizations.
Project milestones can be shown in a simple time line chart in excel. While the chart doesn’t look complicated, it can provide good amount of information on project progress in a simple and understandable chart.
Part 4: Timesheets and Resource management 2009 08 05
http://chandoo.org/wp/2009/08/05/excel-time-sheets-project-management/
For managers, timesheets are a vital component to understand how team is working and where the effort is going.
Part 5: Issue Trackers & Risk Management2009 09 08****http://chandoo.org/wp/2009/09/08/issue-trackers/
Tracking issues and risks is where most of the project management time goes. We will learn how to create a simple issue tracker template using excel and how to analyze issues using excel.
Part 6: Project Status Reporting – Project Management Dashboard 2009 10 06****http://chandoo.org/wp/2009/10/06/project-status-dashboard/
Communication is a very important aspect of project management.
In today’s installment of project management using excel series, we will learn how to make a project management dashboard using Microsoft excel.
.
Use burn down Charts in your project management reports [bonus post] 2019 10 02
https://chandoo.org/wp/burn-down-charts/
A burn down chart is graphical representation of work left to do versus time. The outstanding work (or backlog) is often on the vertical axis, with time along the horizontal. That is, it is a run chart of outstanding work. It is useful for predicting when all of the work will be completed.
PowerPivot
.
GANTT Chart in PowerPivotPt1 2012 08 28
GANTT Chart in PowerPivot, fully dynamic and sliceable!
It’s a rare diversion from the normal Financial stuff that I subject you to! Having run numerous projects and found myself writing endless task lists in Excel so that I can distribute to other people, it suddenly occurred to me that PowerPivot can do this.
Not only can PowerPivot do GANTT Charts, I think it destroys other software in this game. Sure, MS Project is always going to be there and I’m very fond of it, but, anyone familiar with this:
“Thanks for sending that through, but I don’t have MS Project. Can you give me an Excel version or PDF”?”
Maybe you haven’t, but I find myself continuously confronted with distributing Excel task lists and producing my own GANTT charts in Excel to grab screenshots for presentations. PowerPivot gives me (and you) the means to monitor and update tasks quickly and easily, but it also gives you the means to distribute via Sharepoint – awesome!
If you want to just get on with it, GRAB THE FILE HERE and start using it. There’s some brief instructions on how to use it in the file. Otherwise, read on …
Pt2- GANTT Chart with Resource Loading 2012 08 29
Vegard took the template and adapted it to include resource hours. The issue existed with getting the total hours for each resource to behave the way he wanted. Naturally, individuals will normally work for a set expected amount of time per day and if tasks are planned which exceed that expectation, it’s obvious that they might not get the work done!
In this post, I’ll start toexplain how to adapt the model from the previous post to include resource loading and associated subtotals per individual resource.
Pt3- GANTT Reworked with ADDCOLUMNS, FILTER, GENERATE and SUMMARIZE 2012 09 05
GANTT Hours measure debugging with DAX Studio – isn’t it pretty!
At the end of my last post in the GANTT Chart series, GANTT CHART WITH RESOURCE LOADING. I’m now back to explain the workings of that Hours measure. I’ve been working on some “fine tuning” of that Hours measure. I’ll come onto the final solution in due course, but I’ll work through the workings of the Hours measure as we left it initially to explain why it needed tuning up!
For those amongst you with an appreciation of SQL, you might think of this like creating a DAX Equivalent LEFT JOIN between tables with a BETWEEN thrown in for good measure.
Pt 4- CRM Pipeline Funnel Chart (and something on Themes) 2012 09 03
Pipeline Funnel Chart
For now, I thought I would take the opportunity to expose the Pipeline Funnel Chart. It’s really quite straight forward but it’s incredible how few people know that it’s available to everyone, doesn’t require any real manipulation and YES it’s a standard PowerPivot chart!
For those of you that want to dig straight in, YOU CAN DOWNLOAD THE WORKBOOK HERE
.
PowerBI
Or you could go "whole hog" newschool and try PowerBI. It does include native GANTT charts.
.
GANTT- How to make the GANTT chart show events in progress2020 02 25 Darren Gosbell
https://darren.gosbell.com/2020/02/power-bi-how-to-make-the-GANTT-chart-show-events-in-progress/
I had a colleague approach me at work with an interesting problem. He had a Power BI report using the GANTT chart custom visual however when he used a date slicer to select a date range it was only showing events which started on that date range and he wanted to see any events that were in progress for that date range.
I figured out a way to get this working and I thought it might be helpful to not just show the solution, but also to walk through the process I used to develop it. Let’s start by looking at an example of the issue he was dealing with.
.
GANTT (Power BI visuals, Free)https://appsource.microsoft.com/en-us/product/power-bi-visuals/WA104380765
A type of bar chart which illustrates a project timeline or schedule with resources
.
This free ebook has about 40 pages about creating a GANTT in PowerBI
E dash-Dashboards for Excel 2013-Apress (2015).pdf 545pg (downloaded) J Goldmeier, P Duggirala-
https://drive.google.com/file/d/0B0DBjBjJsSoLaW52N3pIcGhLaU0/view?usp=sharing
Ch 13: Creating an Interactive GANTT Chart Dashboard 253
Ch 14: An Interactive GANTT Chart Dashboard, Data Visualization 273
Ch 15: An Interactive GANTT Chart Dashboard, Data Details on Demand 295
.
Hi Anita,
My name is Riley and I'm an Independent Community Adviser. I'm also a regular Microsoft customer like yourself and I'd love to help you with your problem.
My honest opinion is that you'de be better off using a 3rd-party cloud service to manage this. Please have a look at these three:
I can't endorse or recommend any of these, they're just suggestions. I hope this helps.
Kind regards,
Riley
Independent Community Adviser
Current Time Zone: Greenwich Mean Time
PLEASE NOTE: Please allow me some time to reply as my messages might not come through instantly. Thank you for your patience.