Excel text only table/chart and automated refresh

Xin 66 Reputation points
2021-08-08T09:58:27.857+00:00

Wondering if there is any suggestion to achieve the below:

121412-screenshot-2021-08-08-090900.png

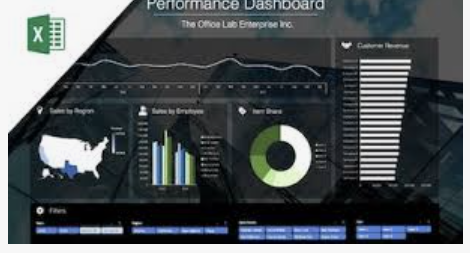
  1. Currently I am putting together a dash board like one example of the below
  2. There is a background photo
  3. Each module has an "Object - Shape" above the background photo with transparent colour
  4. Each module has a chart that shows the analysis, data is linked to pivot table

Problem

  1. All the table with quantitative data are all fine. Chart linked to pivot table in another tab and pivot just needs refresh when someone updated underlying data.
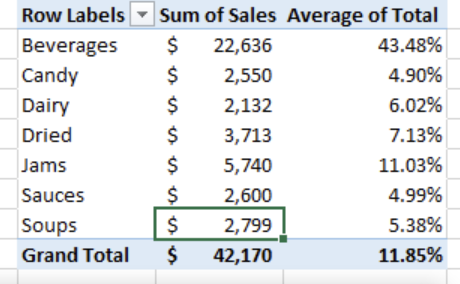
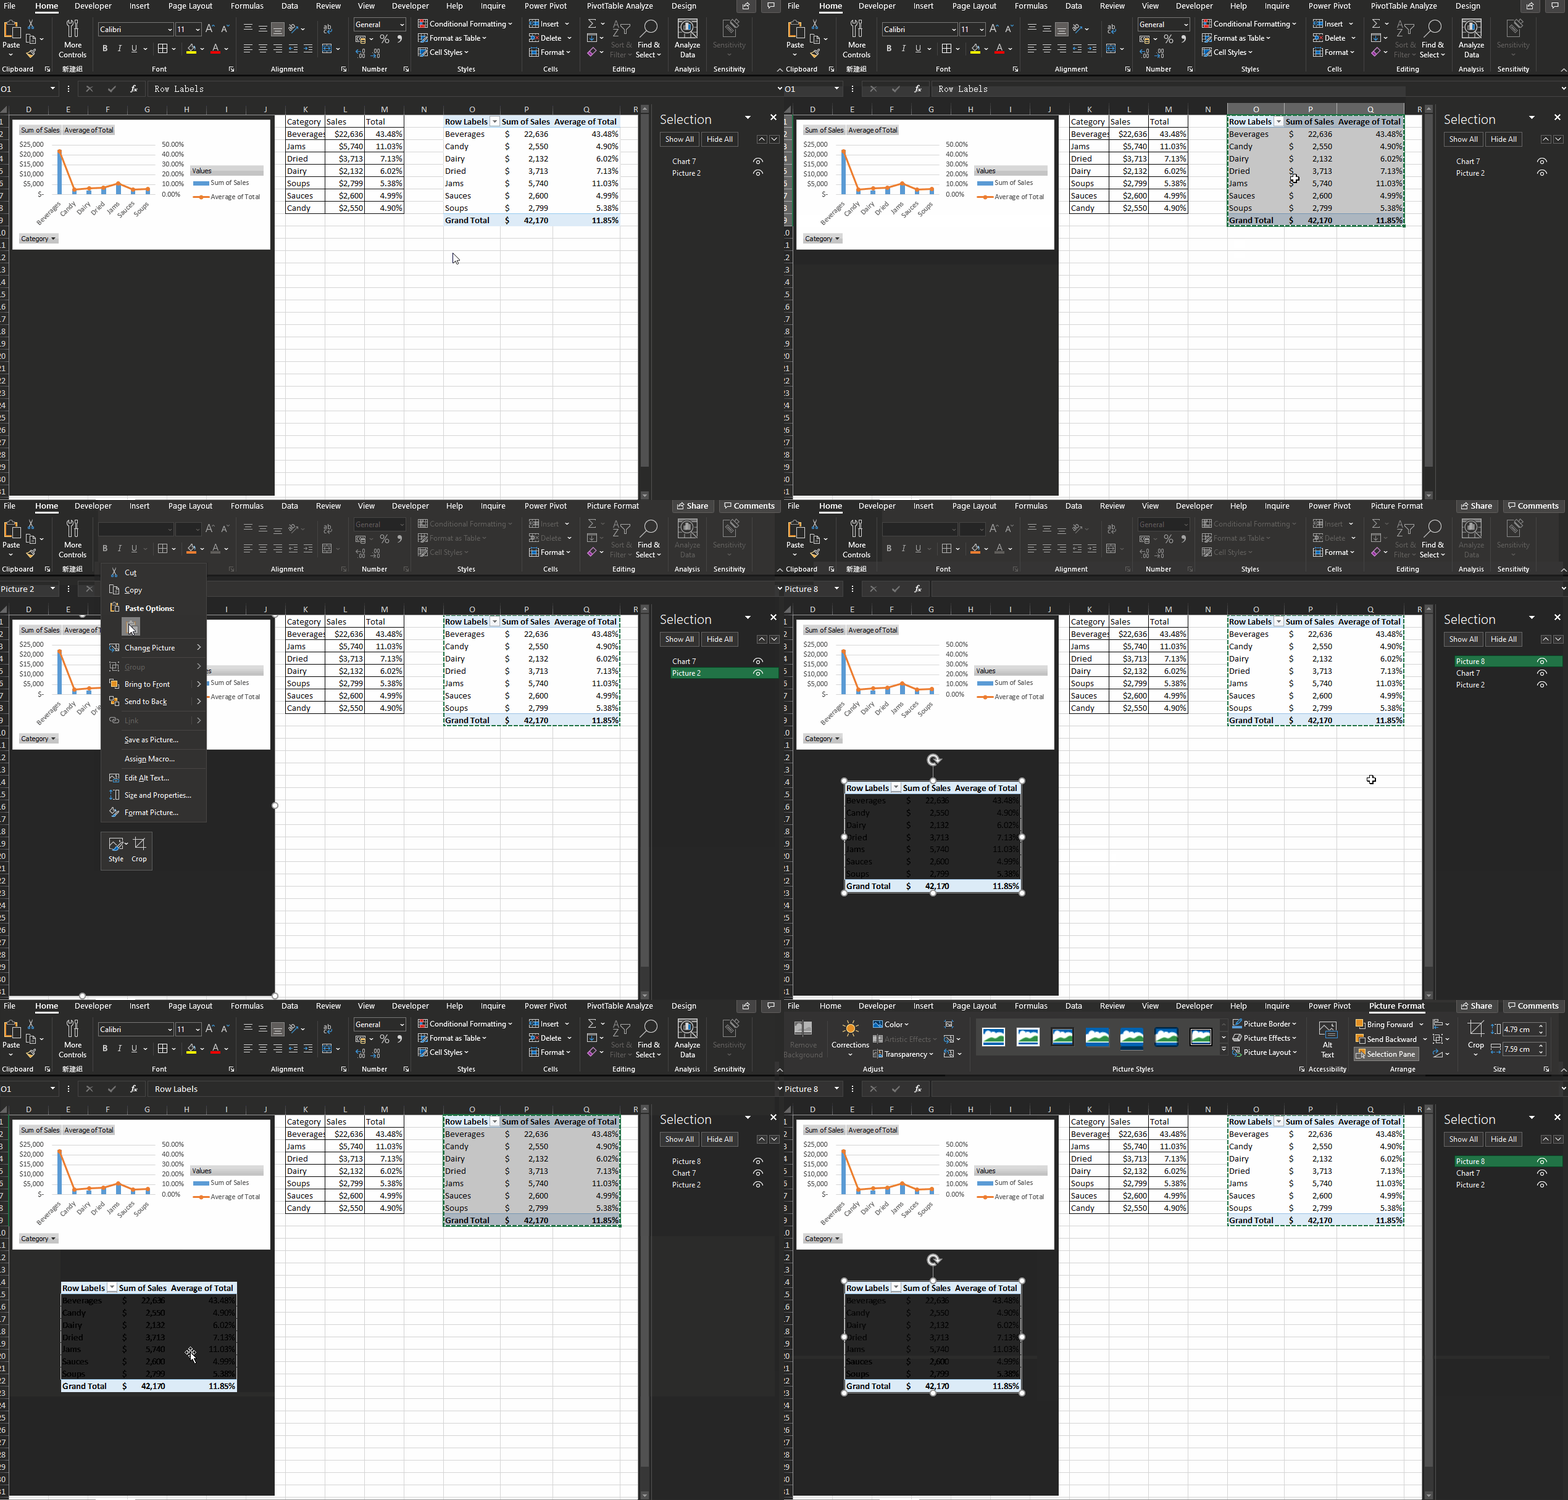
  2. However there is one table with only text and, the current approach is, I created a classic pivot to replicate same format as the underlying text table. The copy and paste into image to include in the below dashboard.
  3. Reason been - I cant link cell within this dashboard to the underlying table because these transparent shapes are above cells and will cover text

End goal

Wondering what's the best approach to create a "text only" table and place within one of these modules within the dashboard where table is linked to another table in another tab where people update that table and this dashboard will get refreshed.

Office Development
Office Development
Office: A suite of Microsoft productivity software that supports common business tasks, including word processing, email, presentations, and data management and analysis.Development: The process of researching, productizing, and refining new or existing technologies.
3,966 questions
Excel Management
Excel Management
Excel: A family of Microsoft spreadsheet software with tools for analyzing, charting, and communicating data.Management: The act or process of organizing, handling, directing or controlling something.
1,725 questions
0 comments No comments
{count} votes

Accepted answer
  1. Viki Ji_MSFT 4,461 Reputation points
    2021-08-09T07:29:11.133+00:00

    @Xin ,
    Welcome to Q&A forum!

    Per my research, you could try to change the Data Source of PivotTable to achieve this.

    • Please back up the file first.
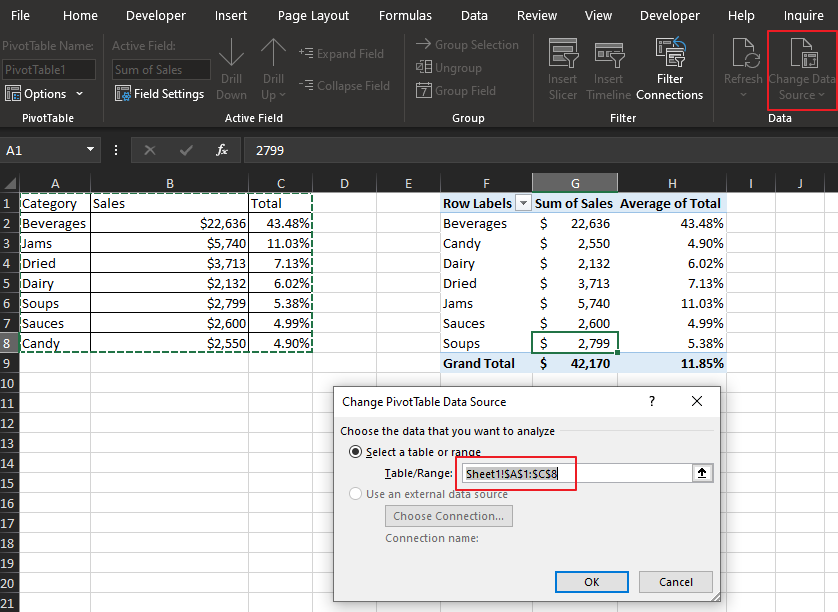
    • Copy the "text only" table to a blank worksheet, then go to the PivotTable linked to the chart.
    • Click Change Data Source in PivotTable Analyze tab and select the range of "text only" table.
    121490-image.png
    Besides, there is an official article about Dashboard, pelase have a check.

    Hope the information is helpful to you.


    If an Answer is helpful, please click "Accept Answer" and upvote it.
    Note: Please follow the steps in our documentation to enable e-mail notifications if you want to receive the related email notification for this thread.

0 additional answers

Sort by: Most helpful

Your answer

Answers can be marked as Accepted Answers by the question author, which helps users to know the answer solved the author's problem.