Linked/Synced graphs in Powerpoint not showing the new series I update in my Excel worksheet

Anonymous
2022-09-21T21:22:57+00:00

I have linked a few graphs from Excel in a Powerpoint that I prepare monthly. The linking is working for updating individual data points (i.e. if X goes from 9 to 20), but it is not working when I try and add a new series entirely.

For example lets say the data I am showing is sales per month: X is month, Y is sales.

If the previous version was sales from January - July it would show if in Powerpoint if I changed the July value in Excel from 9 to 20. However, when I try and add in a new column in my Excel table for August sales, the Excel graph updates, but the Powerpoint graph does not.

Am I linking incorrectly, or does the link not allow for new series to be added?

Microsoft 365 and Office | PowerPoint | For business | Windows

Locked Question. This question was migrated from the Microsoft Support Community. You can vote on whether it's helpful, but you can't add comments or replies or follow the question.

0 comments No comments
{count} vote

3 answers

Sort by: Most helpful
  1. Anonymous
    2022-09-22T01:12:43+00:00

    Dear Michael.MS,

    Good day! Thank you for posting to Microsoft Community. We are happy to help you.

    I carefully went through your question and please don't worry. Together we can solve this situation.

    I tested from my environment, and I If I update data from with in the Source "Excel Workbook", both the Excel graphs and PowerPoint graphs update.

    These are the steps I took:

    1. Created data, and graph from Excel, and saved the file in Documents.
    2. Copied the graph and used Ctrl + V, to paste it into a PowerPoint slide.
    3. From the bottom of the pasted graph, I selected two options for testing: (Use Destination Theme and link data) and (Keep Source Formatting and link data).
    4. Went back to Excel data source and updated the values. Changes reflected in both Excel and PowerPoint, with both link options.

    Image

    Note:

    1. All updates can reflect nonmatter I update the existing values or I add new entries.
    2. But for new entries, if you just add a new entry below the previous last entry, it may not reflect. This is because, before linking the data, you had selected the boundary, and now you have added another entry, outside the linked boundary. for this matter, you may need to link again. but if you add an entry within the boundary, it will reflect fine.

    So now, to better understand your situation and provide proper troubleshooting steps;

    1. Could you please tell us how you linked the graphs?
    2. Also, provide the version of your PowerPoint. From PowerPoint, click File > Account and provide a screenshot of that page.

    If I misinterpreted your question, please feel free to post back and point it out.

    Thank you for your kind understanding and cooperation! We look forward to your reply.

    Sincerely,

    Edwine | Microsoft Community Moderator

    0 comments No comments
  2. Anonymous
    2022-09-22T18:38:41+00:00

    Hi Edwine,

    Thanks for getting back to me. After reading your comment I thought the issue might have been that what you mentioned, that I was adding data outside of the 'range' of my initially selected data group.

    To resolve this, I turned all of the data ranges in my Excel workbook to be Tables which the graphs in Excel are now created from. This way, anytime I increase the range of my Table by adding a new month, the graph expands as well in Excel.

    However, after doing this and linking the graphs to Powerpoint by the method you outlined, I am still not seeing any changes when adding the additional columns. The issue again is isolated to new series, as if I change a data point for an existing series it updates automatically in Powerpoint immediately.

    \

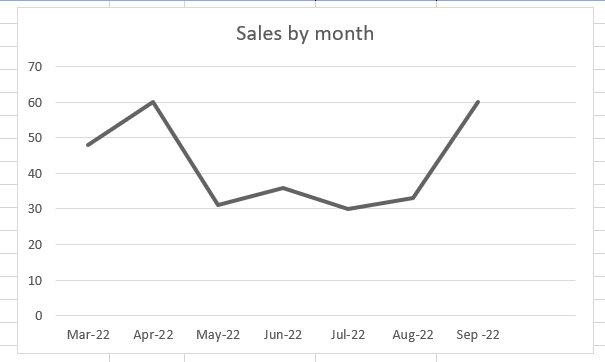
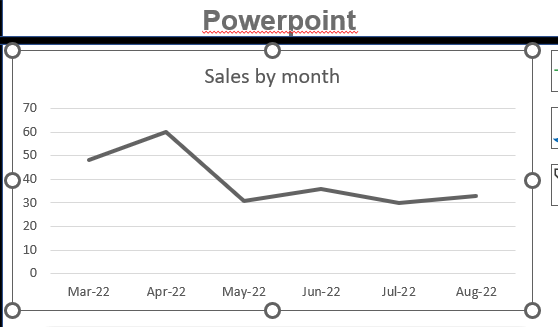
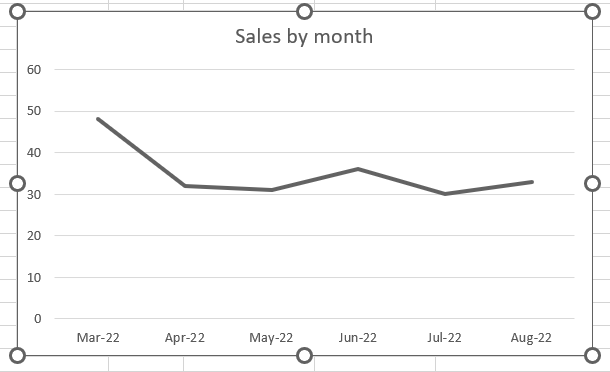
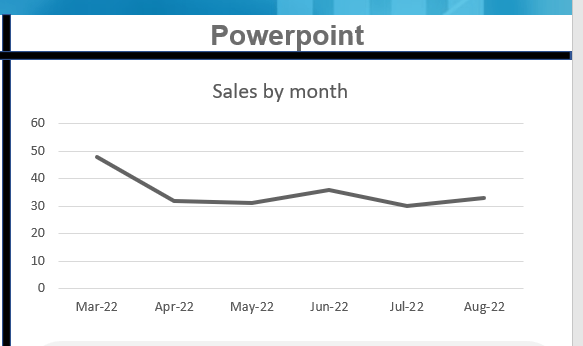
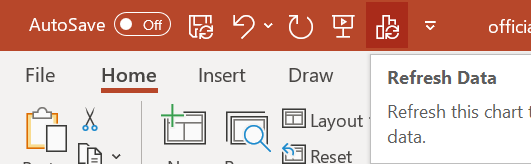
    In these images I've shown how the graphs can initially look exactly the same. But then after updating the data for April and adding September in Excel, only the April adjustment shows up in Powerpoint. This is even after clicking the 'Refresh Data' button I added at the very top of my powerpoint to try and resolve this.

    I've tried pasting as you outlined, CTRL V then selecting CTRL in the bottom right and choosing one of the two linked options. I've also tried right-clicking and pasting via one of those methods directly. Neither are working.

    My Powerpoint version is Microsoft® PowerPoint® for Microsoft 365 MSO (Version 2208 Build 16.0)

    Thank you!

    0 comments No comments
  3. Anonymous
    2022-09-23T07:57:17+00:00

    Hi Michael.MS,

    Thanks for posting back. I appreciate your effort and time you have taken, to do these tests.

    From your description, I also did a couple of tests from my side and I can meet the same behavior. I am afraid!

    Due to this situation, I suggest you send your feedback to the developers team and let them know about this issue so that they can fix it.

    To send feedback to the developers team, click on the Send Feedback button in OneNote Feedback Portal, and in your comment, mention this behavior. Please use this link: Excel · Community (microsoft.com). Microsoft aims to improve its products and services, it values its customer feedback and a lot of features have been improved due to customer feedback. Your feedback is very important. Our Product Team is in-charge of the site and they are constantly checking the comments and feedback from our customers. I'm sure they will fix this. May be they could fix it in the next release.

    Meanwhile, I would like to invite Expert MVPs and other community members to share their rich ideas about a better workaround for this issue.

    Thank you for your kind understanding and cooperation. Stay safe!

    With Sincerest Regards,

    Edwine | Microsoft Community Moderator

    0 comments No comments