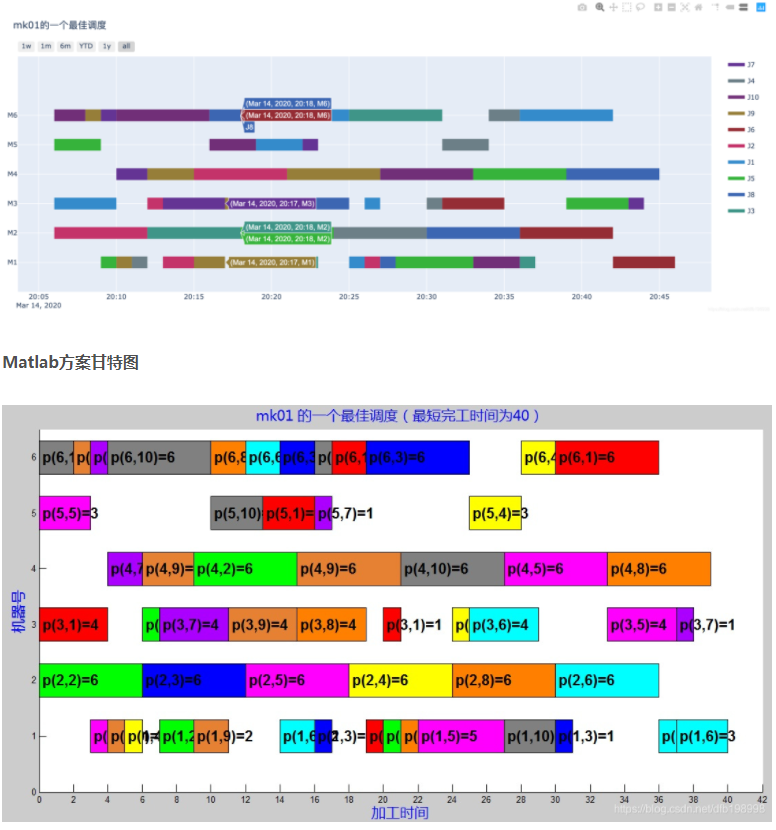
How to draw a complex Gantt chart with Power BI, such as the production scheduling plan of workshop resources

peng su 1 Reputation point
2021-08-18T07:38:53.833+00:00

How to draw a complex Gantt chart with Power BI, such as the production scheduling plan of workshop resources
124205-%E5%BE%AE%E4%BF%A1%E6%88%AA%E5%9B%BE-20210818153220.png

Community Center | Not monitored
0 comments No comments
{count} votes

1 answer

Sort by: Most helpful
  1. Hung-Chun Yu 981 Reputation points Microsoft Employee Moderator
    2021-08-19T01:18:08.127+00:00

    HI @peng su

    Thank you for contact Microsoft Open Specifications Support. It appeared your question is not related to protocols issues outline at https://aka.ms/openspecs.

    Power BI related questions are not supported on this forum. It's better to reach out experts in dedicated forum over here:
    https://community.powerbi.com/t5/Forums/ct-p/PBI_Comm_Forums

    I changed the tag from [openspecs-questions] to [not-supported]

    Never-the-less, here are some reference I found for you
    https://appsource.microsoft.com/en-us/product/power-bi-visuals/WA104380765
    0 comments No comments

Your answer

Answers can be marked as Accepted Answers by the question author, which helps users to know the answer solved the author's problem.