Azure SQL Database
An Azure relational database service.
This browser is no longer supported.
Upgrade to Microsoft Edge to take advantage of the latest features, security updates, and technical support.
' cx='32' cy='32' r='32' /%3E%3Ctext x='50%25' y='55%25' dominant-baseline='middle' text-anchor='middle' fill='%23FFF' %3EFS%3C/text%3E%3C/svg%3E)
Consider this graph from Query Performance Insight:
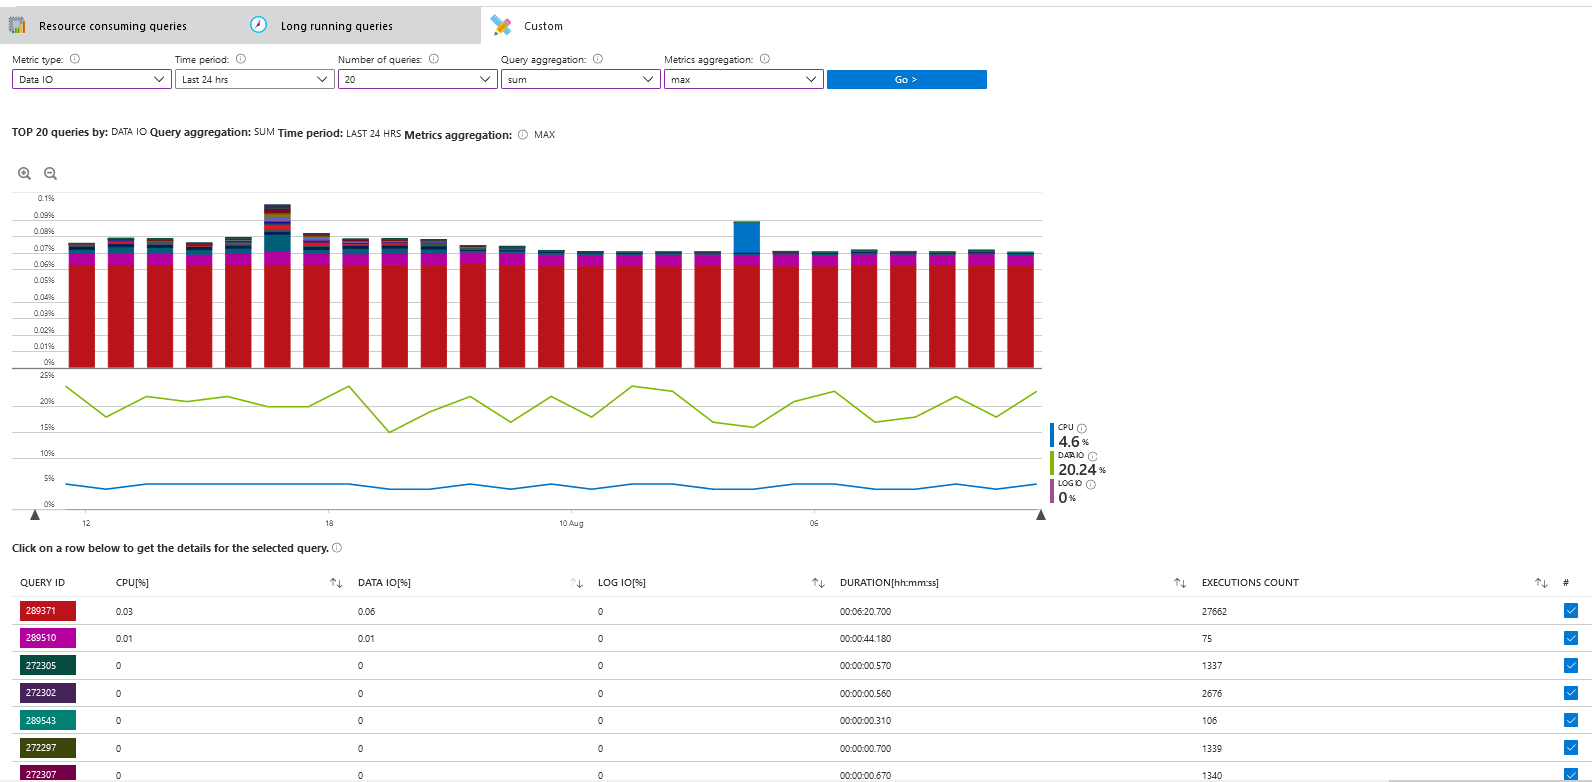
What's interesting about this image is that the green line shows an overall max Data IO metrics of about 20%, while the summed query Data IO is only at 0.08%.
What exactly is the reason for this discrepancy? I know that we have a query that only sometimes causes high Data IO, the rest of the time it doesn't, but that shouldn't get lost when aggregating as "sum", right? Or are averages calculated somehow despite choosing "sum" as the query aggregation?
I'd really be interested to understand this in detail.

@Fabian Schmied Thank you for posting your question. Could you please also check on the metrics report the percentage of Data IO. The difference may come from one of the query listed under the top queries. Could you please click on any row under selected queries to get the details. Did you also try to update statistics.?
Regards,
Oury
@Oury Ba-MSFT Thanks for the reply.
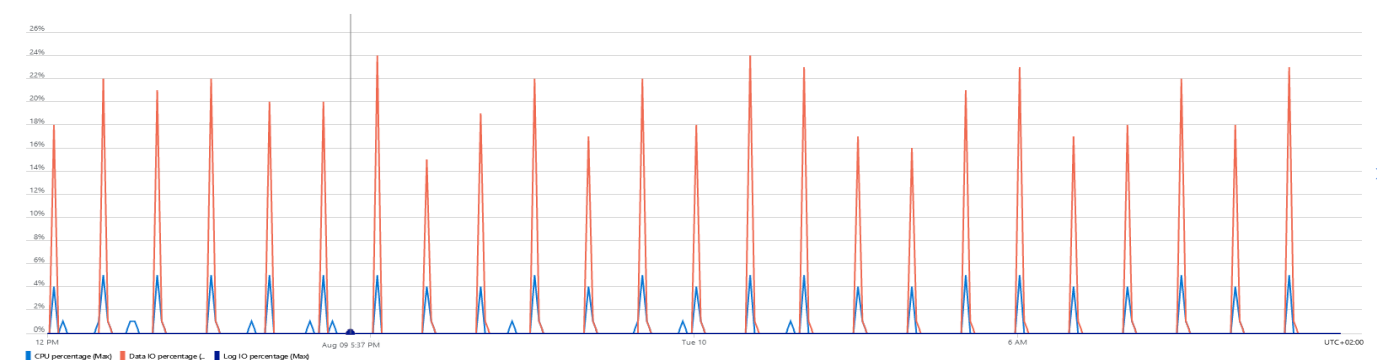
Could you please also check on the metrics report the percentage of Data IO.
The metrics graph shows max Data IO spikes of about 20-25% every hour. So, it's similar to the green line, but at a finer grained interval, thus resulting in spikes.
The difference may come from one of the query listed under the top queries. Could you please click on any row under selected queries to get the details
I'm quite sure that the high usage spikes come from the red query. It's executed very often, and only about once or twice every hour, it will generate a high amount of data I/O.
When I click on the row for the red query, I can see this:
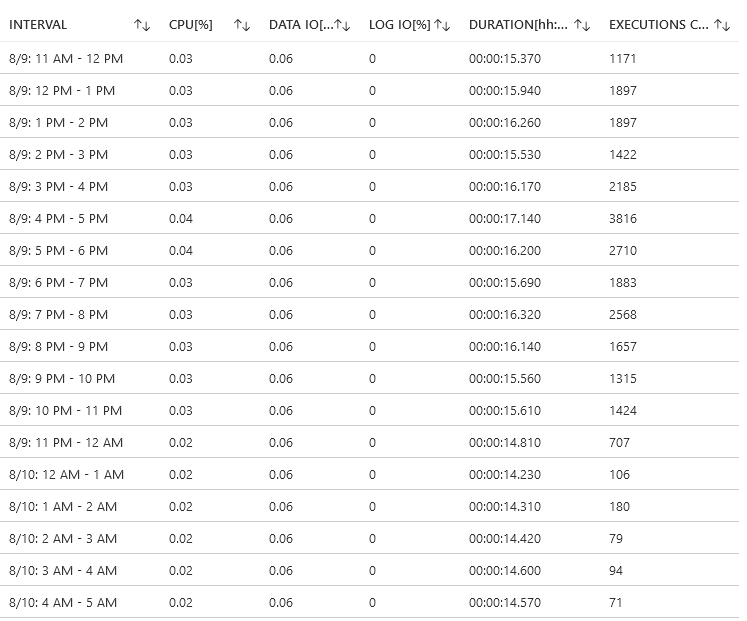
So, it's still 0.06%. Is this an average value despite me selecting "Sum" as the query aggregation?
(If I click one of the queries underneath, e.g., in the fourth row, every line shows 0% Data IO.)
Did you also try to update statistics.?
Do you mean the SQL Server Statistics for query optimization? What would the relationship between those and the Query Performance Insight data be?
Note that my goal with this question is not to find out how to optimize my queries. I just want to understand why there is this difference between the two graphs.
Reflecting about this some more, the 0.06% must probably use a different base value than the 20% do.
E.g., the query statistics might be calculated by aggregating (summing up) all Data IO within the observation period and then dividing it by the total available Data IO, whereas the metrics might be calculated by first dividing the current value by the total value, and then using the result for aggregation. That would explain the different values.
Can someone confirm this? Maybe there's even some documentation?
(Note: https://learn.microsoft.com/en-us/azure/azure-sql/database/query-performance-insight-use explains why the green line is at 20%, but I can't see an explanation for why the red bars are at 0.06% there.
@Fabian Schmied Sorry for the delay in my response. I have completed missed this one.
If anything data reported by Query Performance Indicator will always be below the db reported metrics because it relies on the Query Store data, and can only account for queries that are actually captured by the Query Store. This can be impacted by the capture policy but also by the health of the query store, which if goes into read only mode will fail to capture any workload. Query Performance Insight only considers QueryStore data.
Please let me know if that does not answer your question.
Regards,
Oury
Would this also explain such a large discrepancy (0.06% Data IO vs. 20% Data IO)? We didn't change the Query Store capture policy (i.e., it should be at its default settings) and as I can also reproduce this on another databases (with another installation of the same application), I don't know if the Query Store would be unhealthy on both of them (and for the same time within every hour)?
I still don't understand exactly what those 0.06% actually mean. How's that actually calculated (without hand-waving)? That would help me understand how the value would be different.