SQL Server Reporting Services
A SQL Server technology that supports the creation, management, and delivery of both traditional, paper-oriented reports and interactive, web-based reports.
This browser is no longer supported.
Upgrade to Microsoft Edge to take advantage of the latest features, security updates, and technical support.
' cx='32' cy='32' r='32' /%3E%3Ctext x='50%25' y='55%25' dominant-baseline='middle' text-anchor='middle' fill='%23FFF' %3EMG%3C/text%3E%3C/svg%3E)
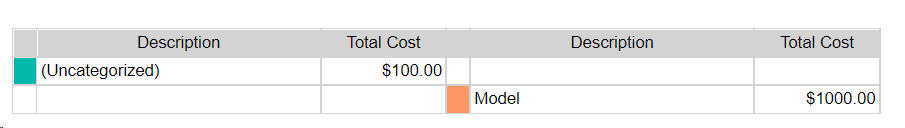
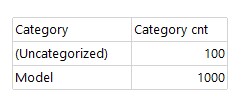
I need to split a table into 4 columns while the data has two columns. There result might look like this:
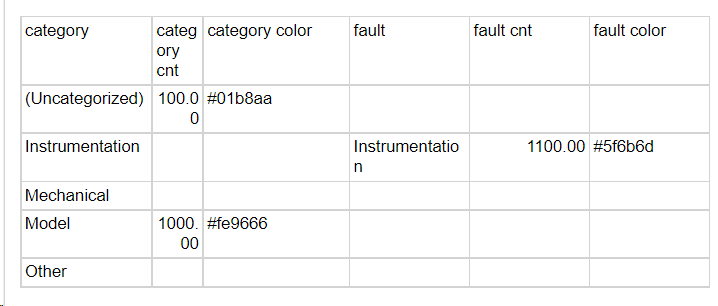
The data is something like this:
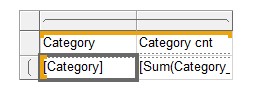
I have the following table configuration:
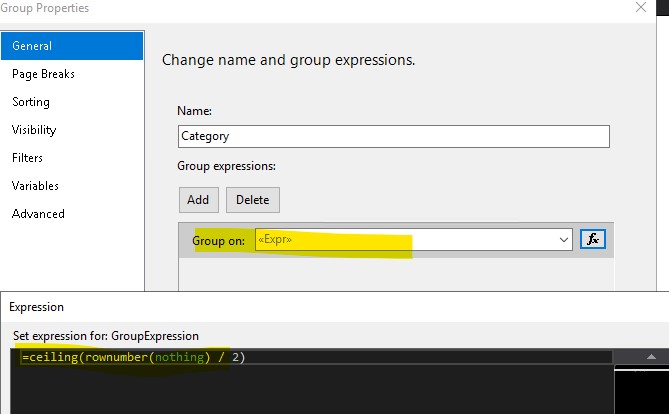
Row group expression:
=ceiling(rownumber(nothing) / 2)
Column group expression:
=rownumber(nothing) mod 2
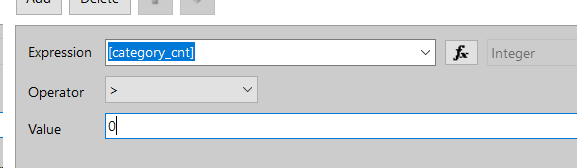
Table filter:
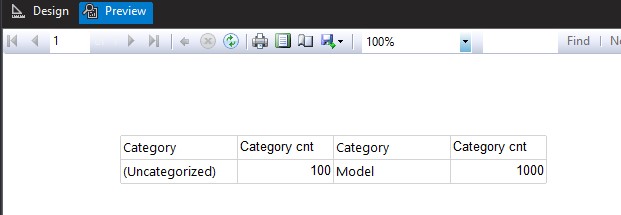
For some reason as th first image show the result has two extra empty rows.
No matter what I do I cannot get rid of them. However, teh same technique would profuce the correct results for the same number of original rows.
The problem only happens where the source table woud have two rows after filtering.
Thanks

User a "newsletter style" pagination instead to get the table into 2 columns, see Pagination in reports (Report Builder and SSRS) => Newsletter-Style Columns

Hi @mark goldin ,
I did the test locally.
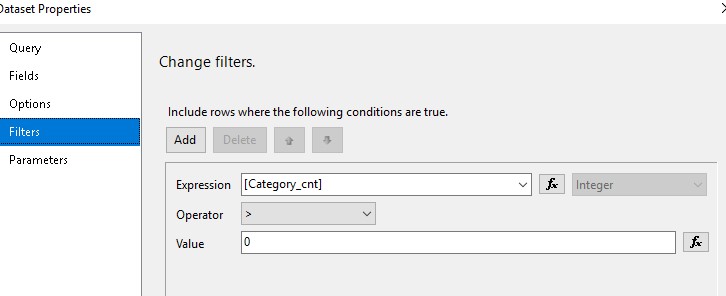
First of all, please filter the dataset, delete and select the required two sets of data. As shown below:
Then I create a Matrix in the report, as shown in the following figure:
Use your previous expressions in row groups and column groups:

Row group expression:
=ceiling(rownumber(nothing) / 2)
Column group expression:
=rownumber(nothing) mod 2
Preview:
Best Regards,
Joy
If the answer is helpful, please click "Accept Answer" and upvote it.
Note: Please follow the steps in our documentation to enable e-mail notifications if you want to receive the related email notification for this thread.
Regarding how to create the matrix:
I followed your steps of creating the matrix. I get the same (bad) results.
Like I said, it only works when rows to show come one after another in the dataset.
I have two datasets. One is working fine:
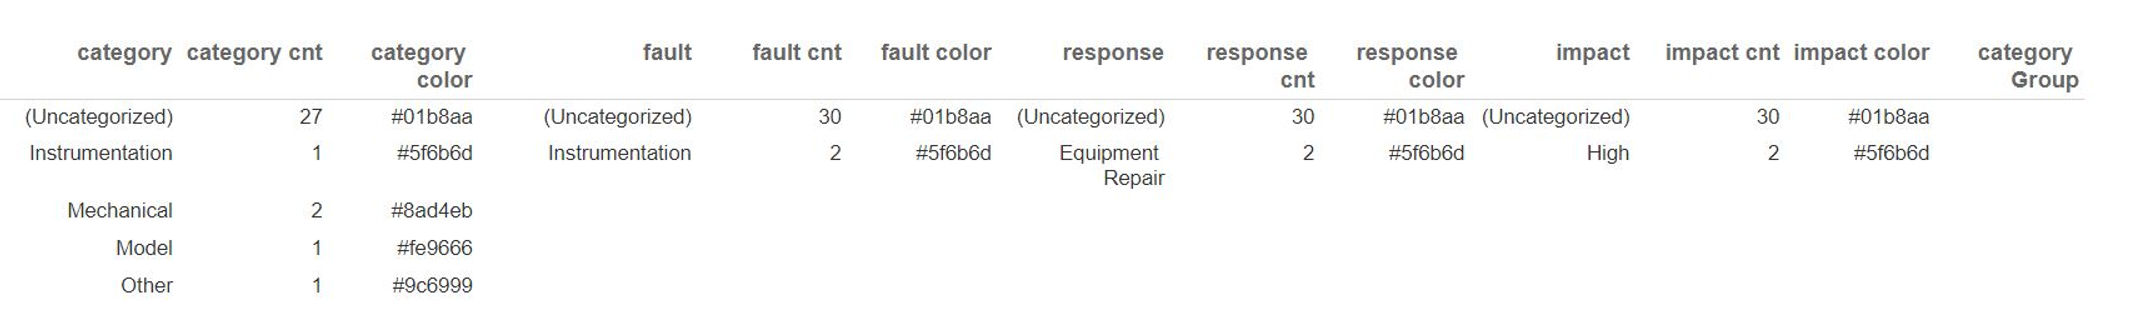
The other is not working:
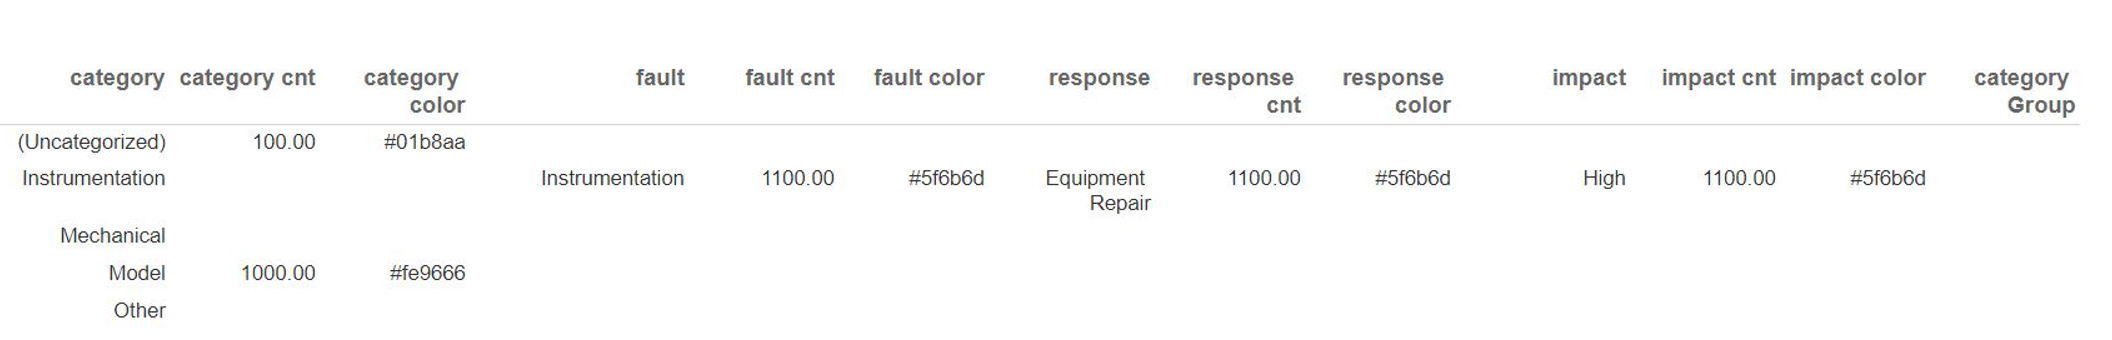
In the first one I am showing faults with fault_cnt <> 0.
In the second I am showing Category with category_cnt <> 0.
The difference in two datasets is that in the first one records to show naturally come together, while in the second they are not.
I tried sorting as an addition to filtering, but it was even worse.
Have you considered sorting when creating the dataset? When you use the Filter in the dataset properties, select only the data you need.