I am curious to know how to convert my List<T> to Pivot datatable.
this is my sample data populated in List.
    List<Data> _data = new List<Data>
    {
        new Data
        {
            Section = "Consensus Model",
            Lineitem = "Net Revenue",
            BrokerCode = "ZB",
            BrokerName = "B Securities",
            Period = "2012 FYA",
            PeriodValue = ""
        },
        new Data
        {
            Section = "Consensus Model",
            Lineitem = "Net Revenue",
            BrokerCode = "ZB",
            BrokerName = "B. Riley Securities",
            Period = "2013 FYA",
            PeriodValue = ""
        },
        new Data
        {
            Section = "Consensus Model",
            Lineitem = "Net Revenue",
            BrokerCode = "ZB",
            BrokerName = "B. Riley Securities",
            Period = "1Q 2014A",
            PeriodValue = "204.45"
        },
        new Data
        {
            Section = "Consensus Model",
            Lineitem = "Net Revenue",
            BrokerCode = "ZB",
            BrokerName = "B. Riley Securities",
            Period = "2Q 2014A",
            PeriodValue = "205.00"
        },
        new Data
        {
            Section = "Consensus Model",
            Lineitem = "Net Revenue",
            BrokerCode = "TU",
            BrokerName = "Cantor Fitzgerald & Co",
            Period = "2012 FYA",
            PeriodValue = "101.33"
        },
        new Data
        {
            Section = "Consensus Model",
            Lineitem = "Net Revenue",
            BrokerCode = "TU",
            BrokerName = "Cantor Fitzgerald & Co",
            Period = "2013 FYA",
            PeriodValue = ""
        },
        new Data
        {
            Section = "Consensus Model",
            Lineitem = "Net Revenue",
            BrokerCode = "TU",
            BrokerName = "Cantor Fitzgerald & Co",
            Period = "1Q 2014A",
            PeriodValue = "204.45"
        },
        new Data
        {
            Section = "Consensus Model",
            Lineitem = "Net Revenue",
            BrokerCode = "TU",
            BrokerName = "Cantor Fitzgerald & Co",
            Period = "2Q 2014A",
            PeriodValue = "201.00"
        },
        new Data
        {
            Section = "Consensus Model",
            Lineitem = "Cost of Goods Sold",
            BrokerCode = "ZB",
            BrokerName = "B. Riley Securities",
            Period = "2012 FYA",
            PeriodValue = ""
        },
        new Data
        {
            Section = "Consensus Model",
            Lineitem = "Cost of Goods Sold",
            BrokerCode = "ZB",
            BrokerName = "B. Riley Securities",
            Period = "2013 FYA",
            PeriodValue = ""
        },
        new Data
        {
            Section = "Consensus Model",
            Lineitem = "Cost of Goods Sold",
            BrokerCode = "ZB",
            BrokerName = "B. Riley Securities",
            Period = "1Q 2014A",
            PeriodValue = "204.45"
        },
        new Data
        {
            Section = "Consensus Model",
            Lineitem = "Cost of Goods Sold",
            BrokerCode = "ZB",
            BrokerName = "B. Riley Securities",
            Period = "2Q 2014A",
            PeriodValue = "201.00"
        },

        new Data
        {
            Section = "Consensus Model",
            Lineitem = "Cost of Goods Sold",
            BrokerCode = "TU",
            BrokerName = "Cantor Fitzgerald & Co",
            Period = "2012 FYA",
            PeriodValue = "101.33"
        },
        new Data
        {
            Section = "Consensus Model",
            Lineitem = "Cost of Goods Sold",
            BrokerCode = "TU",
            BrokerName = "Cantor Fitzgerald & Co",
            Period = "2013 FYA",
            PeriodValue = "222.30"
        },
        new Data
        {
            Section = "Consensus Model",
            Lineitem = "Cost of Goods Sold",
            BrokerCode = "TU",
            BrokerName = "Cantor Fitzgerald & Co",
            Period = "1Q 2014A",
            PeriodValue = "784.45"
        },
        new Data
        {
            Section = "Consensus Model",
            Lineitem = "Cost of Goods Sold",
            BrokerCode = "TU",
            BrokerName = "Cantor Fitzgerald & Co",
            Period = "2Q 2014A",
            PeriodValue = "555.00"
        },
    };
Data grouping should be like Section, Lineitem, BrokerCode & Period sample periods are like 2012 FYA or 2013 FYA...2Q 2014A
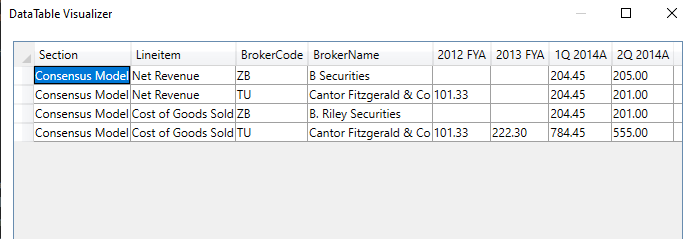
Desired output would be like below example
+-----------------+--------------------+-------------+-------------------+----------+----------+-----------+----------+
|     Section     |      LineItem      | Broker Code |    Broker Name    | 2012 FYA | 2013 FYA | 1Q 2014A  | 2Q 2014A |
+-----------------+--------------------+-------------+-------------------+----------+----------+-----------+----------+
| Consensus Model | Net Revenue        | ZB          | B Securities      |          |          |    204.45 |   205.00 |
| Consensus Model | Net Revenue        | TU          | Cantor Fitzgerald |   101.33 |          |    204.45 |   201.00 |
| Consensus Model | Cost of Goods Sold | ZB          | B Securities      |          |          |    204.45 |   205.00 |
| Consensus Model | Cost of Goods Sold | TU          | Cantor Fitzgerald |   101.33 |          |    204.45 |   201.00 |
+-----------------+--------------------+-------------+-------------------+----------+----------+-----------+----------+
ToPivotTable() function sample code
    public static DataTable ToPivotTable<T, TColumn, TRow, TData>(
        this IEnumerable<T> source,
        Func<T, TColumn> columnSelector,
        Expression<Func<T, TRow>> rowSelector,
        Func<IEnumerable<T>, TData> dataSelector)
            {
                DataTable table = new DataTable();
                var rowName = ((MemberExpression)rowSelector.Body).Member.Name;
                table.Columns.Add(new DataColumn(rowName));
                var columns = source.Select(columnSelector).Distinct();

                foreach (var column in columns)
                    table.Columns.Add(new DataColumn(column.ToString()));

                var rows = source.GroupBy(rowSelector.Compile())
                                 .Select(rowGroup => new
                                 {
                                     Key = rowGroup.Key,
                                     Values = columns.GroupJoin(
                                         rowGroup,
                                         c => c,
                                         r => columnSelector(r),
                                         (c, columnGroup) => dataSelector(columnGroup))
                                 });

                foreach (var row in rows)
                {
                    var dataRow = table.NewRow();
                    var items = row.Values.Cast<object>().ToList();
                    items.Insert(0, row.Key);
                    dataRow.ItemArray = items.ToArray();
                    table.Rows.Add(dataRow);
                }

                return table;
            }
Please guide me how to customize the code in the function ToPivotTable()
As a result i can use that function to get desired output.
if ToPivotTable() function code customization not possible then also tell me how to group data using LINQ to display data as i mention in the post.
Thanks
' cx='32' cy='32' r='32' /%3E%3Ctext x='50%25' y='55%25' dominant-baseline='middle' text-anchor='middle' fill='%23FFF' %3ETZ%3C/text%3E%3C/svg%3E)
' cx='32' cy='32' r='32' /%3E%3Ctext x='50%25' y='55%25' dominant-baseline='middle' text-anchor='middle' fill='%23FFF' %3ETY%3C/text%3E%3C/svg%3E)
' cx='32' cy='32' r='32' /%3E%3Ctext x='50%25' y='55%25' dominant-baseline='middle' text-anchor='middle' fill='%23FFF' %3EVF%3C/text%3E%3C/svg%3E)
' cx='32' cy='32' r='32' /%3E%3Ctext x='50%25' y='55%25' dominant-baseline='middle' text-anchor='middle' fill='%23FFF' %3EEC%3C/text%3E%3C/svg%3E)