Azure Monitor
An Azure service that is used to collect, analyze, and act on telemetry data from Azure and on-premises environments.
3,659 questions
This browser is no longer supported.
Upgrade to Microsoft Edge to take advantage of the latest features, security updates, and technical support.
' cx='32' cy='32' r='32' /%3E%3Ctext x='50%25' y='55%25' dominant-baseline='middle' text-anchor='middle' fill='%23FFF' %3EML%3C/text%3E%3C/svg%3E)
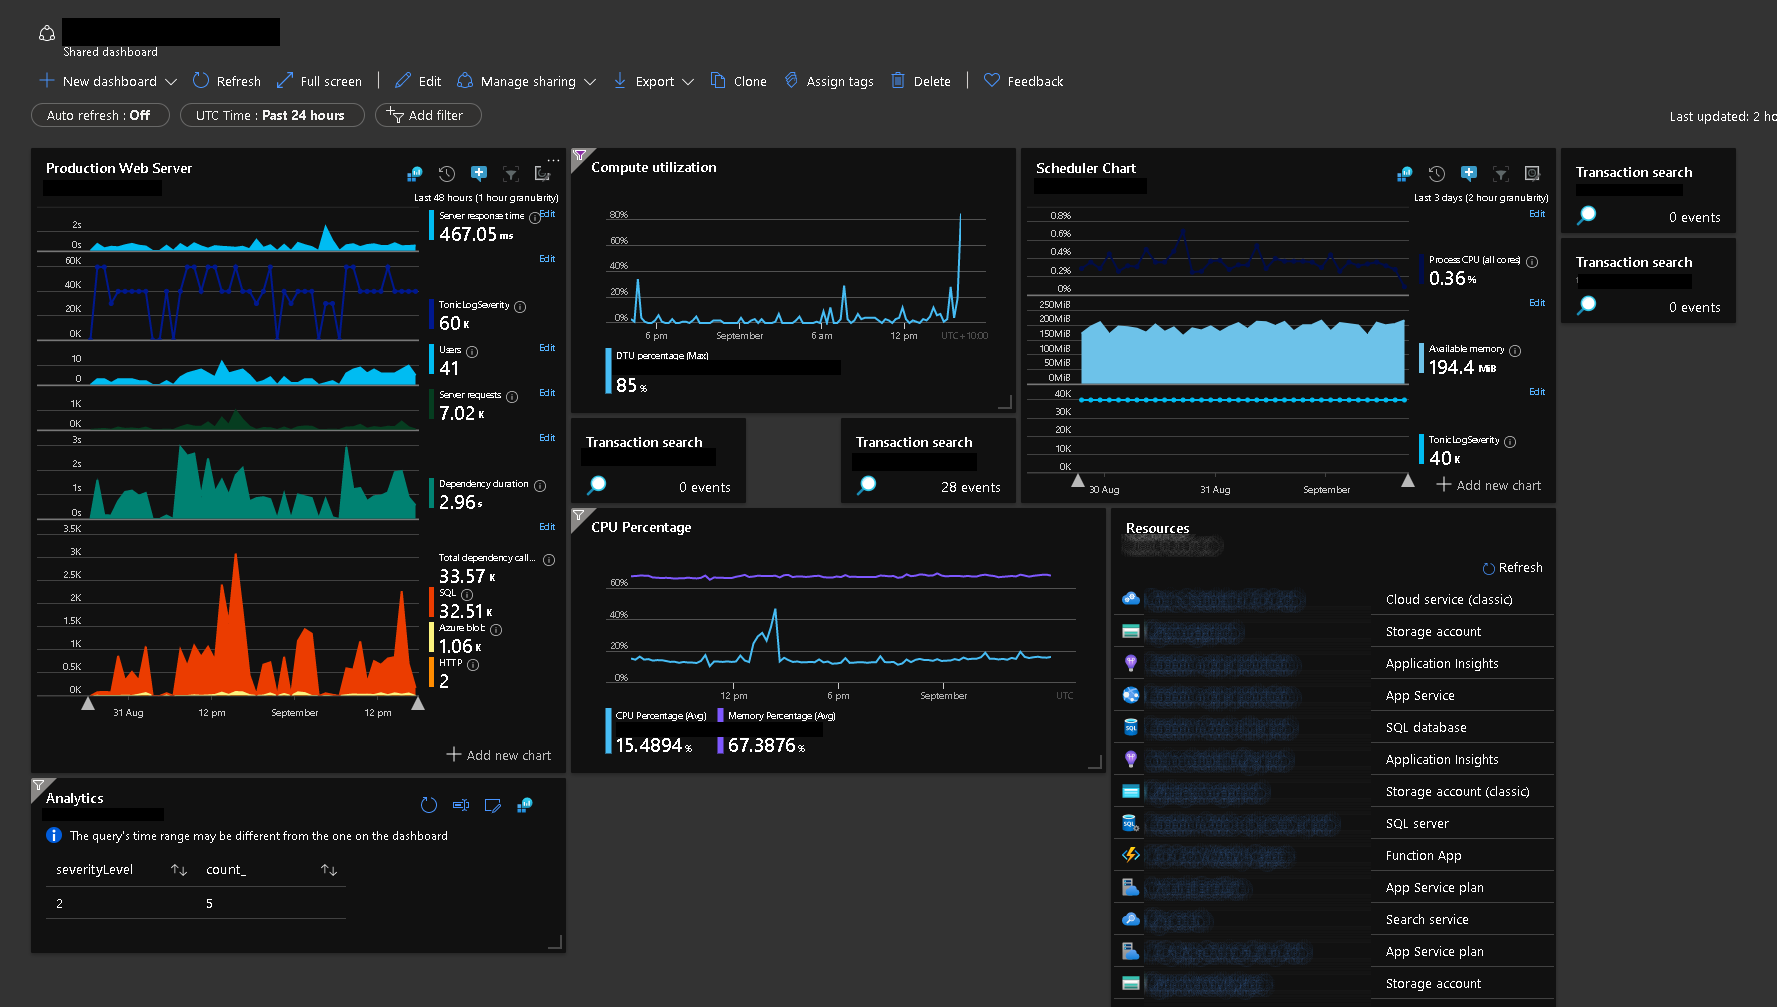
A month ago my dashboards looked like this...
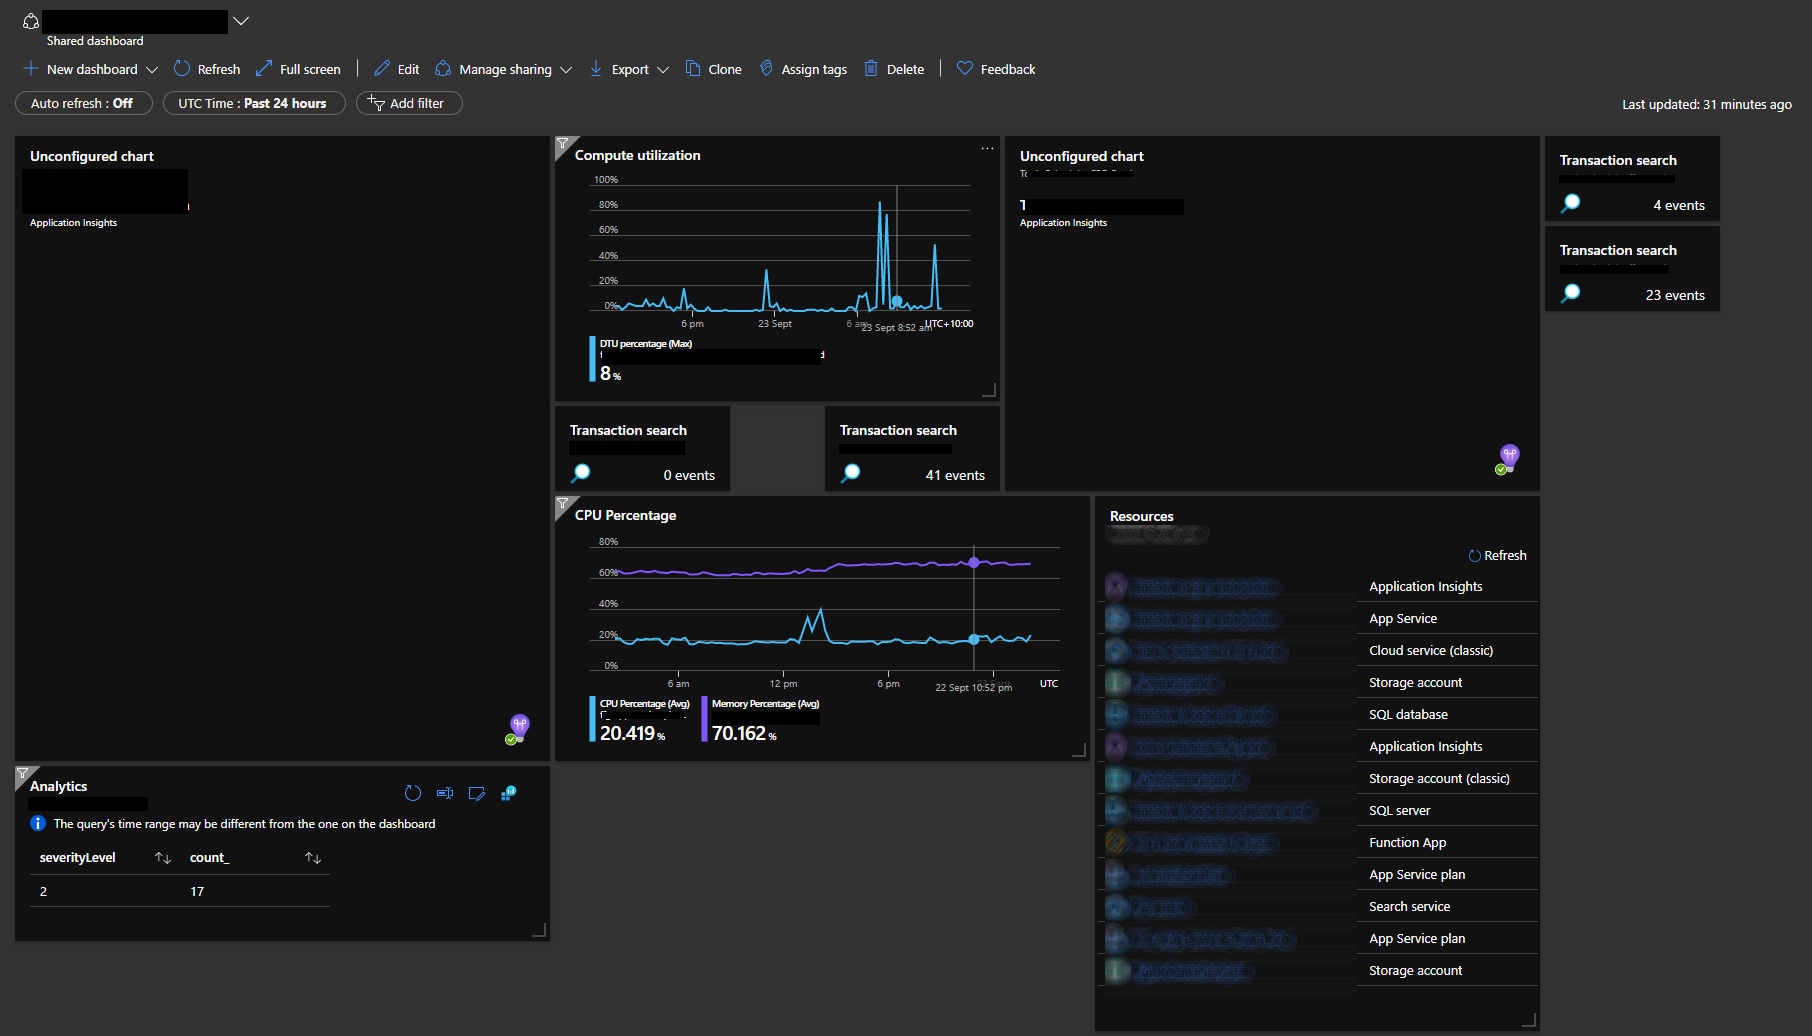
Now they look like this...
And there seems to be no easy way to recreate them.
Yes... I was using older dashboard widgets, if I'd seen anything that looked like it could do a better job than what I already had I would definitely considered using it.
However, even if there is an alternative... these systems are only 6 years old, you would expect any development platform to give you a greater lifespan than that. It's a bit of an ask to put development time into projects that were originally low budget projects for clients who are now paying a minimal amount of money for support.

@Mick Lang Welcome to Microsoft Q&A and thanks for your query.
Apologies for the experience you are having, can you please help us understand if you are able to view the query in application insights query console ? and when you run that query are you seeing the data showing up in the console and only the Azure dashboard part of it is broken ?
Looking forward to hear from you , so that we can help you accordingly.
I have also reached out to our internal team to see if they any other pointers to further review this issue. Will keep you updated as I hear more.
Thank you.
For starters... the chart depicted in the screen shot was constructed at a time when the kusto query language wasn't around. I can't remember the name of the widget, when constructing new dashboards it hasn't been available for a while, but it's continued to function on pre-existing dashboards till now. It was very simple, you dragged it on and selected what you wanted to chart and it just worked, it originally took only a few minutes to set up, there was no need to learn an entirely new complex query language. So there is no kusto query behind the blanked out charts in my screenshot. Sorry if this sounds a little narky, but I feel like I'm explaining your own product to you.
But to answer your question, yes I'm able to create a chart from Application Insights and put it on the dashboard.
I can create 6 new widgets each with a single chart to replace the non-functional widget with 6 charts within it, the end result up taking about 2-3 times the amount of real estate on the dashboard. So yea I can recreate the charts I need, but it'll take me a lot longer than it originally did to set up (when I was a complete Azure novice) and the end result won't be any where near as good.
You have to ask yourself, where have you guys taken this thing over the last five years, when that's the end user experience. i.e. after 5 years of dev, Azure users wanting charts out of application insights have a much steeper learning curve, need to invest a lot more time to produce basic charts and it culminates in an inferior end result.
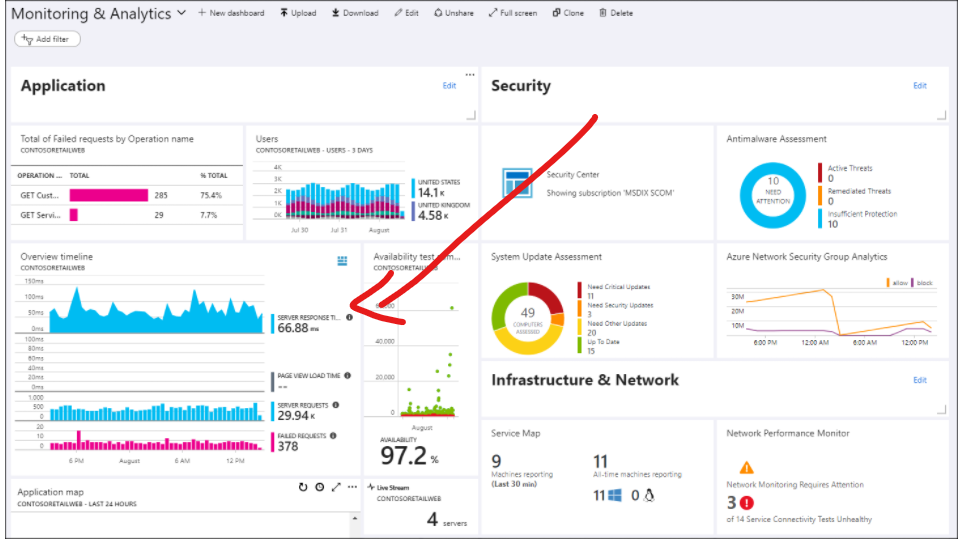
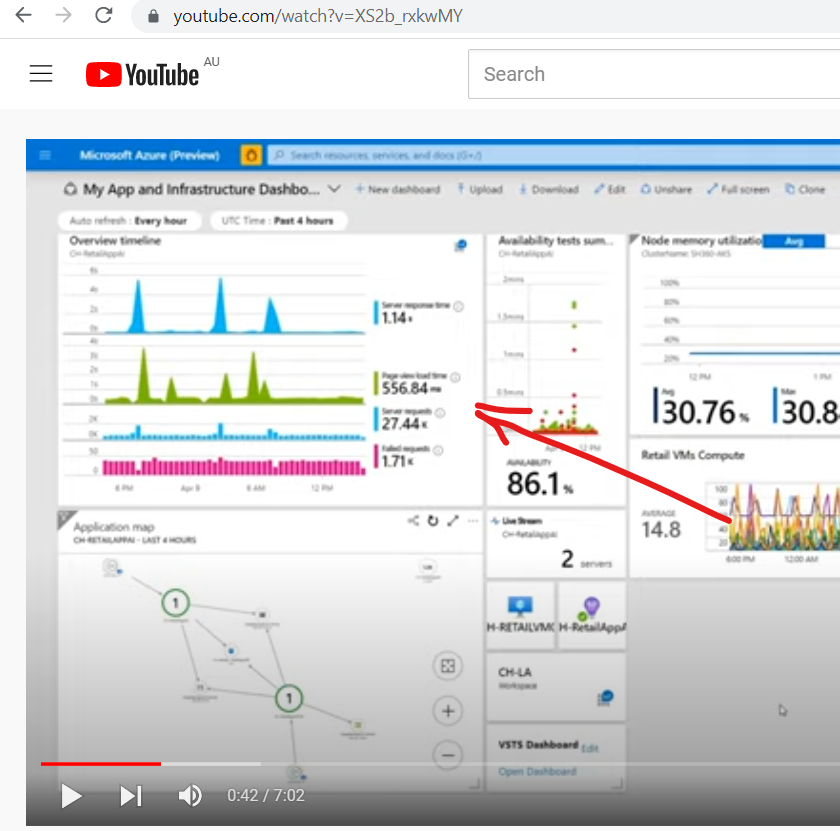
You see the widget I've used (now no longer functional) everywhere in the documentation and videos on dashboards which are splashed up as a "look what you can do with Azure Monitor"....
Here...
https://learn.microsoft.com/en-us/azure/azure-monitor/visualizations
In this video...
https://www.youtube.com/watch?v=XS2b_rxkwMY
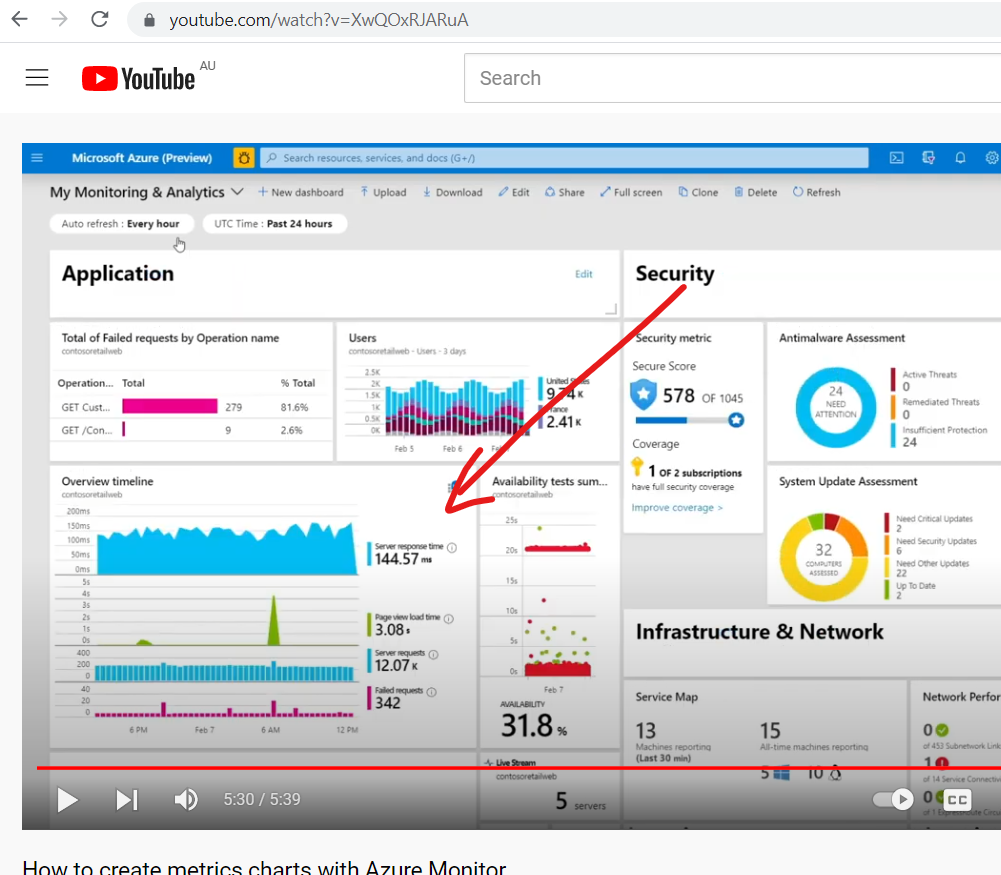
In this video...
https://www.youtube.com/watch?v=XwQOxRJARuA
And numerous other places. And no where can you find anything demonstrating how to create it. I'm pretty sure the reason for this is you can't actually create this widget any more.
For new users unaware of the history of this thing, it must be quite confusing if they look at that and like me think "that's exactly what I want"
@Mick Lang Really appreciate you taking time to share candid feedback on this, I will pass along this feedback to our product team and also our documentation team and we will see how we could improve the experience. Thank you