An easy way to plot in a Visual Studio 2019 C++ program.

Jorgen Sandberg 41 Reputation points
2021-09-27T11:47:35.187+00:00

I want to use Visual Studio 2019 C++ on my Windows 10 machine for simulation of a complex system (An alternative is OCTAVE, but that is not so fast). I need to plot data as the execution progresses.
I have searched the internet for ways to do the plotting and gnuplot is a possibility, but it is very complex to install and make work, and the descriptions, which I have found of how to install and use it, are incomplete.

Is there a step by step description for idiots/novices of how to install and use gnuplot in Visual Studio 2019 C++ ?

Is there a free plotting library offering 2D and 3D plotting in Visual Studio 2019 C++ and a step by step description of how to install and use?

I am aware that I may transfer data from the application to a plotting application, but that does not meet my needs.

Sorry, but I really need a complete and detailed description of the installation and use.

C++
C++
A high-level, general-purpose programming language, created as an extension of the C programming language, that has object-oriented, generic, and functional features in addition to facilities for low-level memory manipulation.
3,690 questions
{count} votes

Accepted answer
  1. Castorix31 84,471 Reputation points
    2021-09-30T08:14:41.977+00:00

    Another simple way is to use System.Windows.Forms.DataVisualization.Charting
    with C++/ CLR (Create C++ Windows Forms application in Visual Studio 2017)

    A test (Chart added from Designer) :
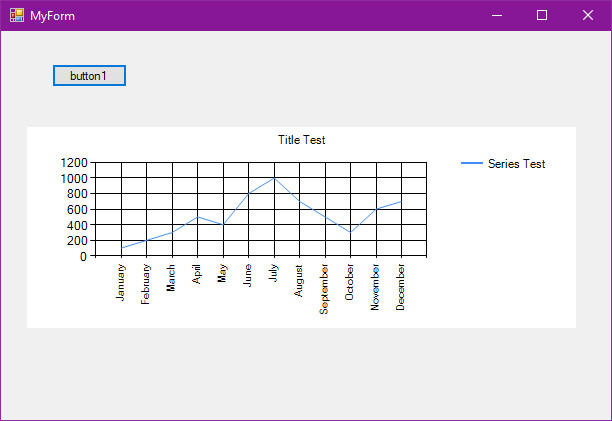
    136651-chart-clr.jpg

            this->chart1->Series->Clear();  
    		this->chart1->Titles->Clear();  
    		Title^ title1 = (gcnew Title());  
    		title1->Text = L"Title Test";  
    		this->chart1->Titles->Add(title1);  
      
    		Series^ series1 = (gcnew Series());  
    		series1->Name = L"Series Test";  
    		this->chart1->Series->Add(series1);	  
      
    		//series1->XValueType = ChartValueType::Auto;  
    		this->chart1->ChartAreas[0]->AxisX->Interval = 1;		  
    		series1->ChartType = SeriesChartType::FastLine;  
    		  
    		series1->Points->AddXY("January", 100);  
    		series1->Points->AddXY("February", 200);  
    		series1->Points->AddXY("March", 300);  
    		series1->Points->AddXY("April", 500);  
    		series1->Points->AddXY("May", 400);  
    		series1->Points->AddXY("June", 800);  
    		series1->Points->AddXY("July", 1000);  
    		series1->Points->AddXY("August", 700);  
    		series1->Points->AddXY("September", 500);  
    		series1->Points->AddXY("October", 300);  
    		series1->Points->AddXY("November", 600);  
    		series1->Points->AddXY("December", 700);  
    

4 additional answers

Sort by: Most helpful
  1. juha partanen 6 Reputation points
    2021-09-28T13:28:11.59+00:00

    Here's a YT video "A detailed walkthrough of setting up Visual Studio C++ to call Gnuplot on a Windows machine."

    Also, there's Python based plot library.,People who are familiar with matplotlib tool in Python, there is a very elegant interface available to call matplotlib of python from C++. A simple example may look like this (source) and the matlabplotcpp.h is available here.

     #include "matplotlibcpp.h"
     namespace plt = matplotlibcpp;
     int main() {
         plt::plot({1,3,2,4});
         plt::show();
     }
    

  2. Jorgen Sandberg 41 Reputation points
    2021-09-30T09:31:57.377+00:00

    Dear Castorix31,

    Thanks a lot. It is, what I was looking for.

    Regards,
    Jorgen Sandberg

    0 comments No comments

  3. Mathwrist 1 Reputation point
    2022-09-25T17:01:39.45+00:00

    Hope this tool helps,

    https://www.mathwrist.com/Product/Description?name=GDE.

    https://www.mathwrist.com/Documentation/Chapter?prod=GDE&feature=OV

    It plots vector and matrix objects in various 2d/3d formats in Visual Studio. Users are welcome to request new features. We will prioritize these requests and add them in future releases.

    Mathwrist.

    0 comments No comments

  4. tim warner 1 Reputation point
    2022-09-25T19:20:30.23+00:00

    I must get in touch with the developer in order to create a service-providing structural engineer website. Please get in touch with me if you can do this.

    0 comments No comments

Your answer

Answers can be marked as Accepted Answers by the question author, which helps users to know the answer solved the author's problem.