SQL Server Reporting Services
A SQL Server technology that supports the creation, management, and delivery of both traditional, paper-oriented reports and interactive, web-based reports.
3,064 questions
This browser is no longer supported.
Upgrade to Microsoft Edge to take advantage of the latest features, security updates, and technical support.
' cx='32' cy='32' r='32' /%3E%3Ctext x='50%25' y='55%25' dominant-baseline='middle' text-anchor='middle' fill='%23FFF' %3EN%3C/text%3E%3C/svg%3E)
I want to show the grouped column values in parallel.
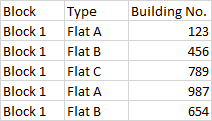
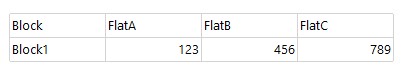
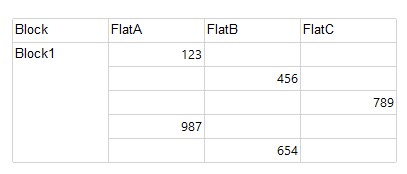
This is the sample data I have, All the values under same Block. I created one Matrix report and Row as Block and Column as Flat, when I run report it's only showing the First value of each column.
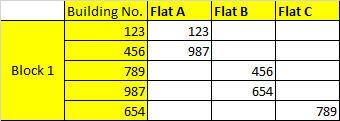
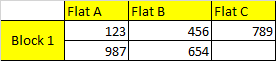
When I insert the Building No. in Row group it's printing like the below 2nd Image,. But I want to show my report like the 3rd picture.
Under Group "Block 1"--> Each Flat Columns--> Print Corresponding Building Number

Hi @Nishanth ,
Before that, we need to understand the properties of the Matrix. Matrices provide functionality similar to crosstabs and pivot tables. The number of rows and columns for groups is determined by the number of unique values for each row and column groups.
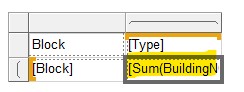
The following figure shows the initial matrix template, selected on the design surface:
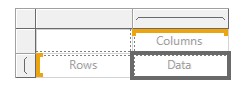
When you drag the fields into the matrix separately, the [Data] displays the sum of the row group and column group crossed, as shown in the figure below:
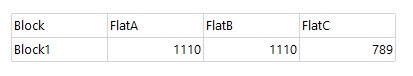
If you manually change the expression of [Data] to "=Fields!BuildingNO_.Value", you will only get the value of the only row.
As you have done so far, you may add the Building No. field in the row group, as shown in your Figure 2. In your figure, "123", "456", and "789" are displayed in a row, and "987" , "654" is displayed in the second row. What is the basis for this division? What I mean is that there are two values for Type FlatA and FlatB, why not "987", "456", "789" is a row or 987", "654", "789" is a row? As shown in the figure below :
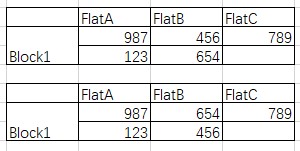
Therefore, the graph we can finally obtain through Matrix will be as shown in your figure two:
I think we cannot determine which row its value appears in for a Type field with two or more values.
Best Regards,
Joy
If the answer is helpful, please click "Accept Answer" and upvote it.
Note: Please follow the steps in our documentation to enable e-mail notifications if you want to receive the related email notification for this thread.