Microsoft 365 and Office | Excel | For business | Windows
A family of Microsoft spreadsheet software with tools for analyzing, charting, and communicating data
This browser is no longer supported.
Upgrade to Microsoft Edge to take advantage of the latest features, security updates, and technical support.
' cx='32' cy='32' r='32' /%3E%3Ctext x='50%25' y='55%25' dominant-baseline='middle' text-anchor='middle' fill='%23FFF' %3EJ%3C/text%3E%3C/svg%3E)
Hello experts!
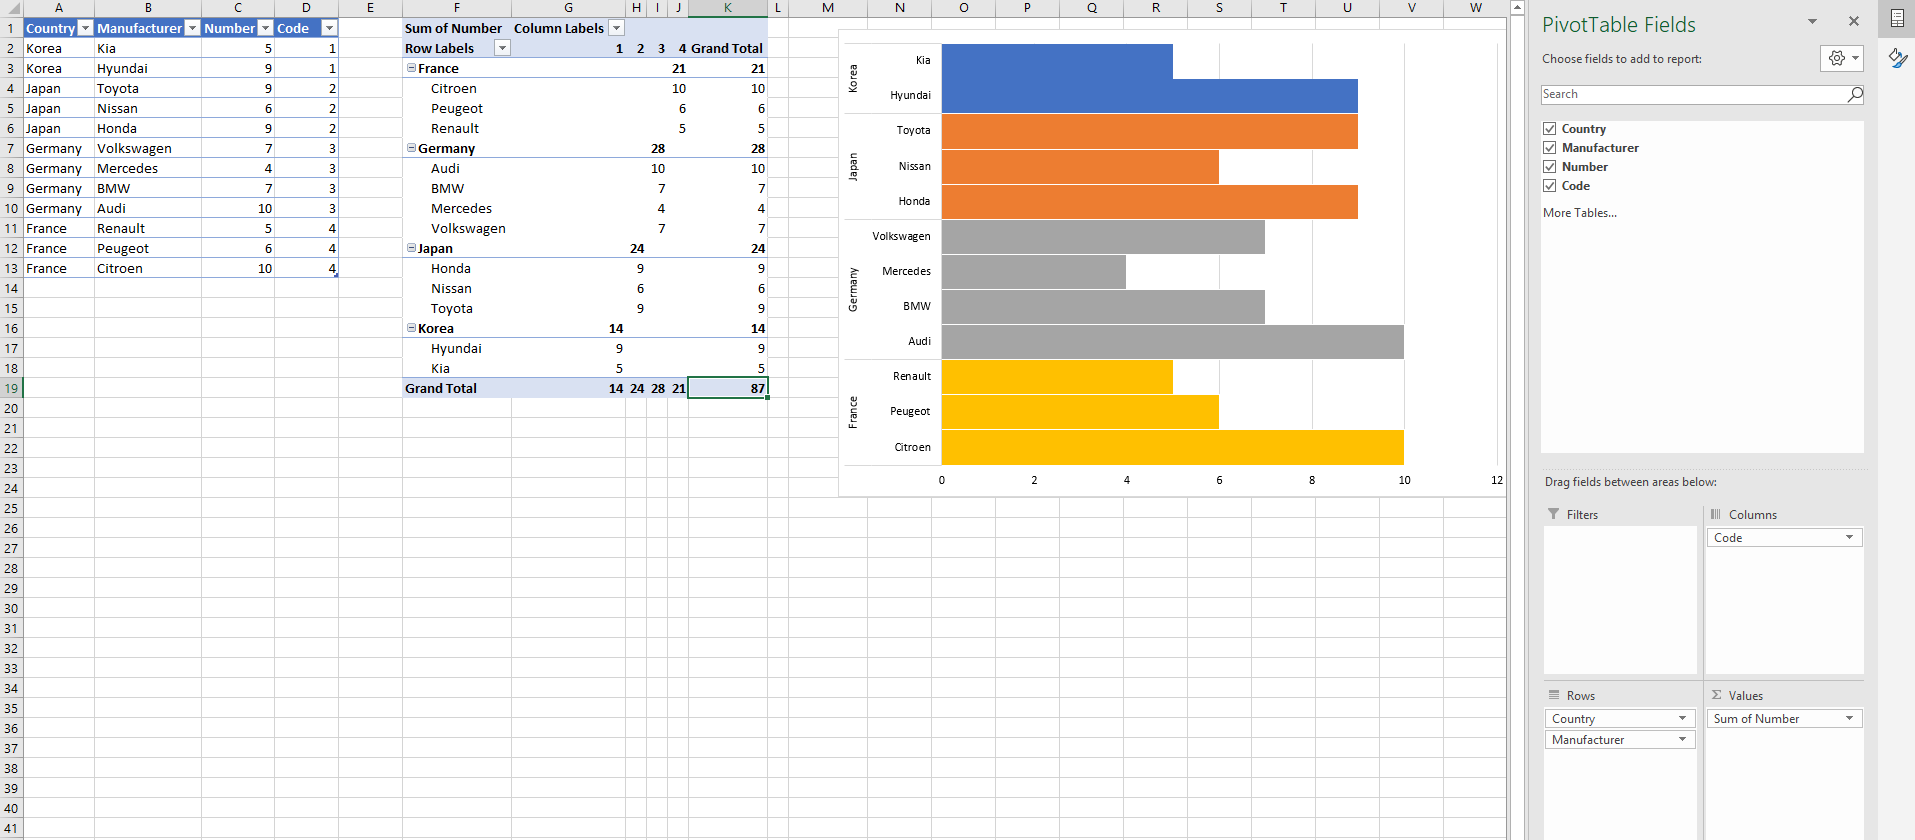
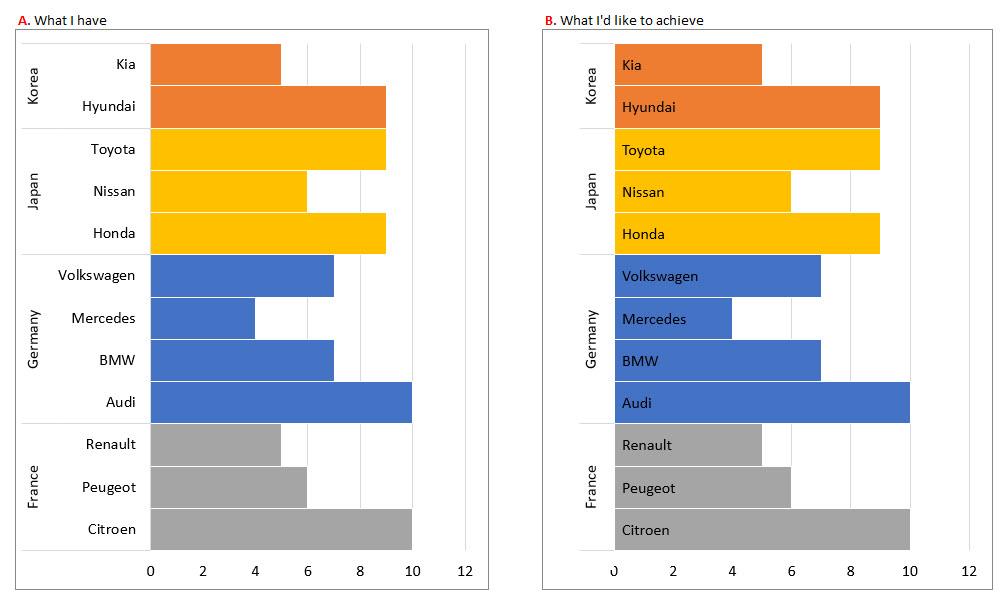
I have a bar chart that uses a multi-level category, similar to the example below.
To save space in the Y axis labelling area, I'd like to have car manufacturers names on top of each bar while retaining the group names (=country) in the Y axis with a bar for each manufacturer.
Really hope there is a way...
I'm using Office365.
Thanks in advance!
JP

Hi @JP ,
Welcome to the Q&A forum!
For better testing, please share the source data or screenshots of the Excel chart with us.
Besides, please describe in detail how you generated the chart?
Thanks for your understanding.
Hi @JP ,
Thanks for your replay and sharing.
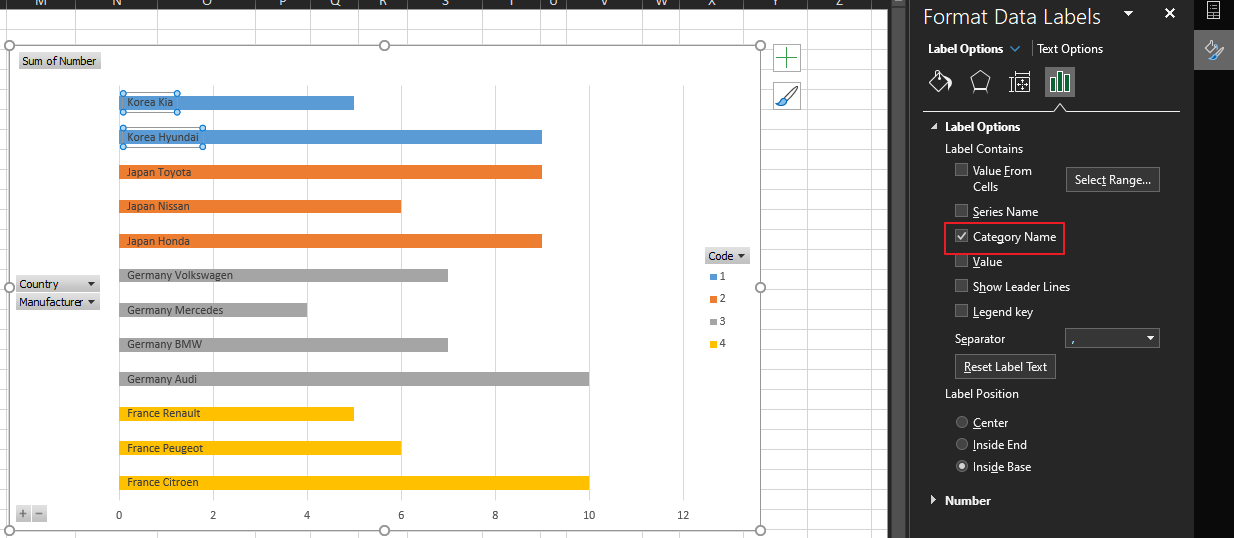
Per my testing, we may have to manually add it to our data label. The detailed steps are shown in the figure below:
But because both Country and Manufacturer columns are category columns, we may not be able to keep only the Country column.
Thanks for your understanding.
In addition, you can also try to display both in the data bar.
Hope the information is helpful to you.
If the answer is helpful, please click "Accept Answer" and kindly upvote it. If you have extra questions about this answer, please click "Comment".
Note: Please follow the steps in our documentation to enable e-mail notifications if you want to receive the related email notification for this thread.
Thanks for that, @Viki Ji_MSFT .
Yes as you noted, my main goal was to keep the Country names in the Y axis, while the Manufacturers bars are still individually displayed in the plot area.
I think I will leave this question open for a little longer for more suggestions.
I wonder if I could move the Y axis labelling area to the right and overlap it with the plot area... Can I?
Hi @JP ,
Thanks for your replay.
> I wonder if I could move the Y axis labelling area to the right and overlap it with the plot area... Can I?
< Per my research and testing, I am sorry that you may not be able to achieve this.
Hope you can get other solutions soon. Have a nice day~
Doesnt seem like there is a way.
Thanks everyone.
Hi @JP ,
Thanks for your reply and updates.
If you have any issues about Office client in the future, welcome to Q&A forum.
Hope to have a nice day~
' cx='32' cy='32' r='32' /%3E%3Ctext x='50%25' y='55%25' dominant-baseline='middle' text-anchor='middle' fill='%23FFF' %3EHC%3C/text%3E%3C/svg%3E)
Its great. Where do you get this detail? Thanks in advance.