Hello, I would like to know what fills the TEMPdb system database.
I created the following session in Extended Events:
CREATE EVENT SESSION [DBA-DC_TEMPdb] ON SERVER
	ADD EVENT sqlserver.databases_data_file_size_changed (
		ACTION(package0.process_id, sqlserver.client_app_name, sqlserver.client_hostname, sqlserver.client_pid, sqlserver.database_id, sqlserver.is_system, sqlserver.nt_username, sqlserver.plan_handle, sqlserver.query_hash, sqlserver.query_plan_hash, sqlserver.request_id, sqlserver.server_principal_name, sqlserver.session_id, sqlserver.session_nt_username, sqlserver.session_server_principal_name, sqlserver.sql_text, sqlserver.transaction_id, sqlserver.username))
	, ADD EVENT sqlserver.databases_log_file_size_changed (
		ACTION(package0.process_id, sqlserver.client_app_name, sqlserver.client_hostname, sqlserver.client_pid, sqlserver.database_id, sqlserver.is_system, sqlserver.nt_username, sqlserver.plan_handle, sqlserver.query_hash, sqlserver.query_plan_hash, sqlserver.request_id, sqlserver.server_principal_name, sqlserver.session_id, sqlserver.session_nt_username, sqlserver.session_server_principal_name, sqlserver.sql_text, sqlserver.transaction_id, sqlserver.username))
	, ADD EVENT sqlserver.databases_log_file_used_size_changed (
		ACTION(package0.process_id, sqlserver.client_app_name, sqlserver.client_hostname, sqlserver.client_pid, sqlserver.database_id, sqlserver.is_system, sqlserver.nt_username, sqlserver.plan_handle, sqlserver.query_hash, sqlserver.query_plan_hash, sqlserver.request_id, sqlserver.server_principal_name, sqlserver.session_id, sqlserver.session_nt_username, sqlserver.session_server_principal_name, sqlserver.sql_text, sqlserver.transaction_id, sqlserver.username)
		WHERE ([sqlserver].[database_id] = (2)))
	ADD TARGET package0.event_file (SET filename = N'DBA-DC_TEMPdb', max_file_size = (200), max_rollover_files = (20))
	WITH (
			MAX_MEMORY = 8192 KB
			, EVENT_RETENTION_MODE = ALLOW_SINGLE_EVENT_LOSS
			, MAX_DISPATCH_LATENCY = 60 SECONDS
			, MAX_EVENT_SIZE = 0 KB
			, MEMORY_PARTITION_MODE = NONE
			, TRACK_CAUSALITY = ON
			, STARTUP_STATE = ON
			)
GO
Unfortunately, in the output file I can see only the following data:
----------

The same as text:
----------
attach_activity_id.guid = 7FB37348-E62C-476E-8A38-BAA1FE6CE3E1
attach_activity_id.seq = 85
attach_activity_id_xfer.guid = NULL
attach_activity_id_xfer.seq = NULL
client_app_name =
client_hostname =
client_pid = 0
count = 328964
database_id = 2
is_system = TRUE
name = databases_log_file_used_size_changed
nt_username =
plan_handle = 0x0000000000000000000000000000000000000000000000000000000000000000000000000000000000000000
process_id = 20312
query_hash = 0
query_plan_hash = 0
request_id = 0
server_principal_name = sa
session_id = 14
session_nt_username =
timestamp = 05/11/2021 07:54:19
timestamp (UTC) = 05/11/2021 06:54:19
transaction_id = 0
username = sa
----------
Why there:
- are empty (or 0) values in “query_hash”, “query_plan_hash”, “plan_handle”, “transaction_id”, etc? What does it mean?
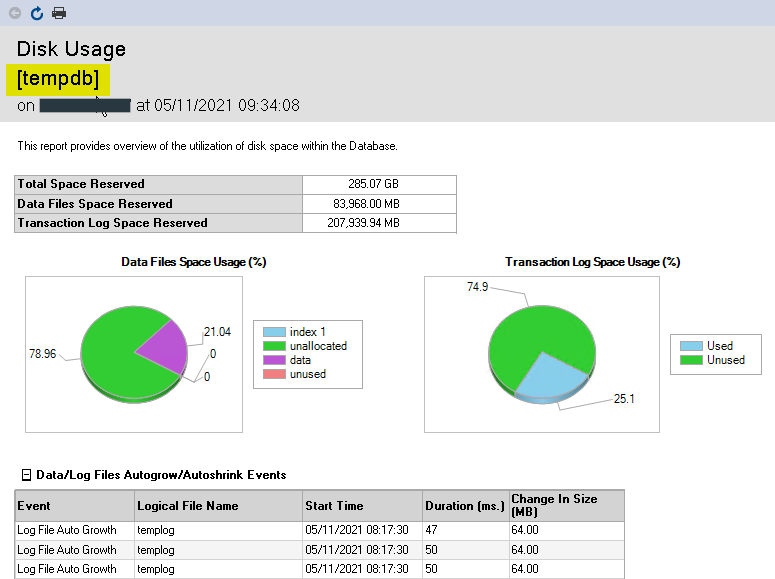
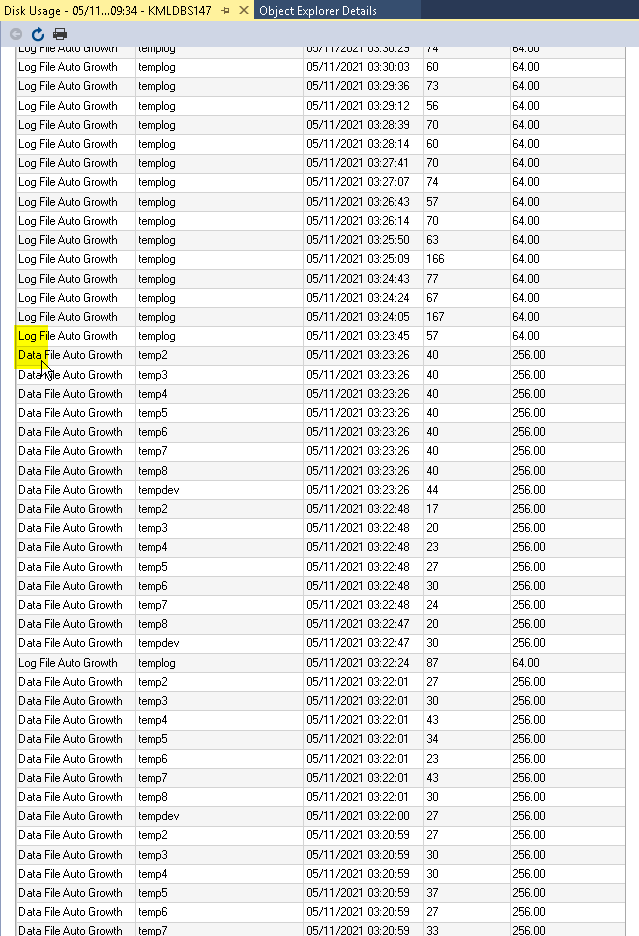
- Are not records where “name” is “databases_data_file_size_changed” or “databases_log_file_size_changed”? Because in standard SSMS report “Disk Usage” (for database TEMPdb) I can see a lot of “Data/Log Files Autogrow/Autoshrink Events”:
...
P.S.
We use:
- Microsoft SQL Server 2016 (SP2-CU15) (KB4577775) - 13.0.5850.14 (X64) Sep 17 2020 22:12:45 Copyright (c) Microsoft Corporation Enterprise Edition (64-bit) on Windows Server 2016 Datacenter 10.0 <X64> (Build 14393: ) (Hypervisor)
- “Replication” in this instance.
I have already tried find help by Google on following web-pages:
• https://dba.stackexchange.com/questions/19870/how-to-identify-which-query-is-filling-up-the-tempdb-transaction-log
• https://www.sqlservercentral.com/scripts/tempdb-usage-per-active-session
• https://www.brentozar.com/archive/2020/11/video-how-to-troubleshoot-someone-elses-temp-table-contents/
• Fixed Size TempDB, MERGE into very large table failing due to space, is this a limitation of merge? : https://learn.microsoft.com/en-us/answers/questions/229171/fixed-size-tempdb-merge-into-very-large-table-fail.html
• Why does my DELETE command require huge amount of temporary run storage? : https://dba.stackexchange.com/questions/190140/why-does-my-delete-command-require-huge-amount-of-temporary-run-storage
• Questions tagged [tempdb] : https://stackoverflow.com/questions/tagged/tempdb?page=1&sort=Active&pageSize=50
• SQL Server TempDB - Will a Hash Match operator always cause tempdb allocations? : https://stackoverflow.com/questions/57623608/sql-server-tempdb-will-a-hash-match-operator-always-cause-tempdb-allocations
• Understanding Hash, Sort and Exchange Spill events : http://rusanu.com/2011/10/19/understanding-hash-sort-and-exchange-spill-events/
• SQL Server – Hash Join Execution Internals : https://www.sqlshack.com/hash-join-execution-internals/
• https://social.msdn.microsoft.com/Forums/en-US/a909280f-8353-48fa-8d93-4b880268fb4a/monitoring-tempdb?forum=sqldatabaseengine
• https://social.msdn.microsoft.com/Forums/en-US/2f6cd0fe-1cab-4b6e-a5a6-7e60f9ff0ac6/can-i-monitor-what-goes-in-tempdb?forum=sqldatabaseengine
• https://social.msdn.microsoft.com/Forums/en-US/021ca5b5-7495-4911-a6fa-433a6f12eece/monitor-tempdb-growth?forum=sqldatabaseengine
unfortunately without success. ☹
' cx='32' cy='32' r='32' /%3E%3Ctext x='50%25' y='55%25' dominant-baseline='middle' text-anchor='middle' fill='%23FFF' %3EDK%3C/text%3E%3C/svg%3E)
' cx='32' cy='32' r='32' /%3E%3Ctext x='50%25' y='55%25' dominant-baseline='middle' text-anchor='middle' fill='%23FFF' %3ESX%3C/text%3E%3C/svg%3E)
' cx='32' cy='32' r='32' /%3E%3Ctext x='50%25' y='55%25' dominant-baseline='middle' text-anchor='middle' fill='%23FFF' %3ETP%3C/text%3E%3C/svg%3E)
