' cx='32' cy='32' r='32' /%3E%3Ctext x='50%25' y='55%25' dominant-baseline='middle' text-anchor='middle' fill='%23FFF' %3EWZ%3C/text%3E%3C/svg%3E)
4,826 questions
' cx='32' cy='32' r='32' /%3E%3Ctext x='50%25' y='55%25' dominant-baseline='middle' text-anchor='middle' fill='%23FFF' %3EA%3C/text%3E%3C/svg%3E)
' cx='32' cy='32' r='32' /%3E%3Ctext x='50%25' y='55%25' dominant-baseline='middle' text-anchor='middle' fill='%23FFF' %3EA%3C/text%3E%3C/svg%3E)
WillianZmorzynski-9153, Adding to ZhiLv-MSFT response, from Azure WebApps stand-point. To isolate the issue further, kindly try these:
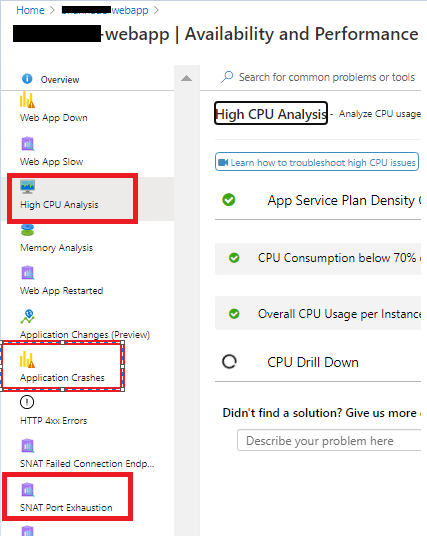
If you haven't done this already, you may leverage App Service diagnostics from Azure Portal> Navigate to your App Service app in the Azure Portal. In the left navigation, click on Diagnose and solve problems and “Availability and Performance”. Go over the highlighted (screenshot below) options- to see if it provides additional pointers. And. you could also create a process dump, and then analyse the process dump.
SSE uses long-polling requests, it may hit the 230s limit. Azure Load Balancer has a default idle timeout setting of four minutes (~230 secs). If your web app requires background processing, it is recommended to use Azure WebJobs or Azure Functions. Kindly ensure if Always-On feature is turned ON.
I understand you’re running the WebApp on a single instance, to isolate you may also consider to scale out two multiple instances (as a test). Running your app on only one VM instance is an immediate single point-of-failure. By ensuring that you have multiple instances allocated to your app, if something goes wrong with any particular instance, your app will still be able to respond to requests going to the other instances.
For production apps that are aiming to be robust, it is recommended to set Always on to On and ARR Affinity to Off. However, disabling ARR Affinity assumes that your application is either stateless, or the session state is stored on a remote service such as a cache or database.