Developer technologies | C#
An object-oriented and type-safe programming language that has its roots in the C family of languages and includes support for component-oriented programming.
This browser is no longer supported.
Upgrade to Microsoft Edge to take advantage of the latest features, security updates, and technical support.
' cx='32' cy='32' r='32' /%3E%3Ctext x='50%25' y='55%25' dominant-baseline='middle' text-anchor='middle' fill='%23FFF' %3EDB%3C/text%3E%3C/svg%3E)
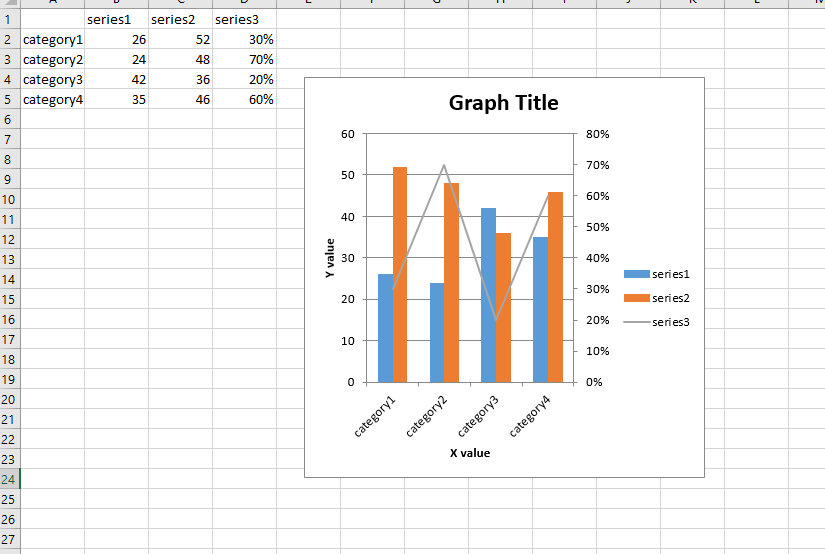
I am planning to create Combo Charts using c# can you please guide me how i can achieve that.
The chart is a combination of clustered column and line chart and i am planning to achieve it using microsoft.office.interop dll. to use it for reporting purpose.
Our existing application is using Macros and we want to upgrade it from macros to C# dll.

@Deepak Banavathu , Welcome to Microsoft Q&A,
You could refer to the following code to create a Combo Chart by using microsoft.office.interop dll.
Code:(using Excel = Microsoft.Office.Interop.Excel;)
    Excel.Application app = new Excel.Application();
    Excel.Workbook workbook = app.Workbooks.Open("D:\\1.xlsx");
    Excel.Worksheet worksheet = workbook.Sheets[1];
    var charts = worksheet.ChartObjects() as Excel.ChartObjects;
    var chartObject = charts.Add(60, 10, 300, 300) as Excel.ChartObject;
    var chart = chartObject.Chart;
    var range = worksheet.get_Range("A1", "D5");
    chart.SetSourceData(range);
    chart.FullSeriesCollection(1).ChartType = Excel.XlChartType.xlColumnClustered;
    chart.FullSeriesCollection(2).ChartType = Excel.XlChartType.xlColumnClustered;
    chart.FullSeriesCollection(3).ChartType = Excel.XlChartType.xlLine;
    chart.FullSeriesCollection(3).AxisGroup = Excel.XlAxisGroup.xlSecondary;

    chart.ChartWizard(Source: range,
        Title: "Graph Title",
        CategoryTitle: "X value",
        ValueTitle: "Y value");
    //Set chart range.
   // Save.
   workbook.Save();
   workbook.Close();
Result:
Hope the code example could help you.
Best Regards,
Jack
If the answer is the right solution, please click "Accept Answer" and kindly upvote it. If you have extra questions about this answer, please click "Comment".
Note: Please follow the steps in our documentation to enable e-mail notifications if you want to receive the related email notification for this thread.
Also is there anyway we can save the chart which was created in the excel to be saved as an image using the same interop dll?
When i referred net i couldn't get a solution to saving the chart into an image.
@Deepak Banavathu , you could refer to the following link to save the chart to image by using interop dll.
Hi Jack,
can we achieve the same using openXML means creating the chart?
Can you suggest me on that as well?
Thanks
' cx='32' cy='32' r='32' /%3E%3Ctext x='50%25' y='55%25' dominant-baseline='middle' text-anchor='middle' fill='%23FFF' %3EC6%3C/text%3E%3C/svg%3E)
Adapt the sample from the documentation : https://learn.microsoft.com/en-us/office/open-xml/how-to-insert-a-chart-into-a-spreadsheet
' cx='32' cy='32' r='32' /%3E%3Ctext x='50%25' y='55%25' dominant-baseline='middle' text-anchor='middle' fill='%23FFF' %3ESR%3C/text%3E%3C/svg%3E)
Hi everyone,
I have a problem with first line of this code. When I run my code, I receive an error "System.IO.FileNotFoundException: 'Could not load file or assembly' office, Version=15.0.0.0".
Can you please help me to come over this problem.
' cx='32' cy='32' r='32' /%3E%3Ctext x='50%25' y='55%25' dominant-baseline='middle' text-anchor='middle' fill='%23FFF' %3ED%3C/text%3E%3C/svg%3E)
As an alternative solution, you can use Spire.XLS for .NET to create a chart that combines clustered column chart and line chart, and export it as an image.
Here are useful links that you can refer to.
C#/VB.NET - Create a Combination Chart in Excel
C#/VB.NET - Save Excel Charts as Images