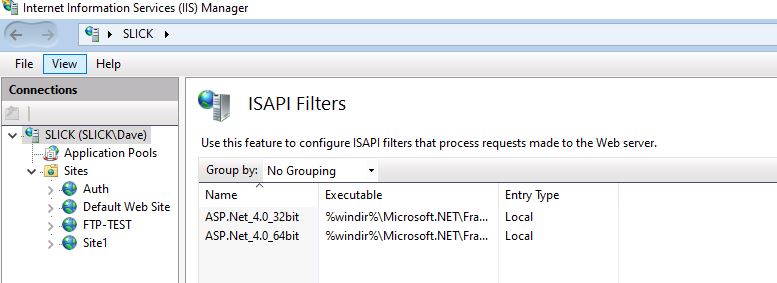
0xc00000fd Error and Debug Diag freeze IIS

Mark Dagley 1 Reputation point
2021-11-11T13:50:29.913+00:00

we have 2 servers where are getting a recurring 0xc00000fd error, also on occasion, we get an app pool time out the restarts the app pool without the error that I think this is related.
when the error occurs it creates a Just in Time debugger that does not really tell us anything and if you clear the error the app pool restarts.

everything I have read says that the only way to get to the bottom of this is to use the MS Debug 2 Collection tool, the problem is when I set this up the we site connected to the app pool freezes

in the log file we get

Loading control script C:\Program Files\DebugDiag\scripts\CrashRule_WebAppPool_AppPoolName.vbs
DumpPath set to C:\Temp\NG Dump
[09/11/2021 22:20:51]
DebugDiag version 2.3.2.11
DbgHost version 2.3.2.11
DbgSvc version 2.3.2.11
Process created. BaseModule - c:\windows\system32\inetsrv\w3wp.exe. BaseThread - System ID: 51980
C:\Windows\SYSTEM32\ntdll.dll loaded at 0x20250000
Thread created. New thread - System ID: 42032
Thread created. New thread - System ID: 18512
Thread created. New thread - System ID: 17228
Thread created. New thread - System ID: 38064
Thread created. New thread - System ID: 19380
Thread created. New thread - System ID: 43580
Thread created. New thread - System ID: 38236

this Thread Created occurs till I kill the tool in task manager then the App pool restarts

the full error is

Faulting application name: w3wp.exe, version: 10.0.14393.0, time stamp: 0x57899b8a
Faulting module name: KERNEL32.DLL, version: 10.0.14393.4651, time stamp: 0x613d606a
Exception code: 0xc00000fd
Fault offset: 0x0000000000011cb9
Faulting process id: 0x99ec
Faulting application start time: 0x01d7d5b5ce17180f
Faulting application path: c:\windows\system32\inetsrv\w3wp.exe
Faulting module path: C:\Windows\System32\KERNEL32.DLL
Report Id: 33883336-dfca-425a-82d7-3e2e35371ff8
Faulting package full name:
Faulting package-relative application ID:

or

Faulting application name: w3wp.exe, version: 10.0.14393.0, time stamp: 0x57899b8a
Faulting module name: clr.dll, version: 4.7.3850.0, time stamp: 0x60d67f8a
Exception code: 0xc00000fd
Fault offset: 0x00000000000de810
Faulting process id: 0x4694
Faulting application start time: 0x01d7d51a2bde2f57
Faulting application path: c:\windows\system32\inetsrv\w3wp.exe
Faulting module path: C:\Windows\Microsoft.NET\Framework64\v4.0.30319\clr.dll
Report Id: 9d7ac2a9-7cba-49c1-a35f-f3748f108183
Faulting package full name:
Faulting package-relative application ID:

we have Windows Server 2016 , the web app is based on .net 4.5.2 IIS runs on one system and the SQL server is a separate server.
We have tried setting the debug tool up to monitor the whole of IIS and a specific app pool just for this error but the result is the same the site stops until the debug collection service is killed off.

Does anyone have any ideas's what the issue might be or how to figure it out?

Windows development | Internet Information Services
Windows for business | Windows Server | User experience | Other
Developer technologies | .NET | Other
{count} votes

3 answers

Sort by: Most helpful
  1. Limitless Technology 39,926 Reputation points
    2021-11-11T20:00:20.12+00:00

    Hello @Mark Dagley

    The issue occurs because IIS has a Stack Memory limitation that limits how deeply nested values lists and calculations are allowed to be, usually anything over 50 items depth nesting. Records that exceed the IIS limit will cause the IIS process to crash.

    You will need to check the app database for any recursion over 50 levels, and restructure the values to avoid the issue.

    Hope this helps with your query,

    ------------

    --If the reply is helpful, please Upvote and Accept as answer--

    0 comments No comments

  2. Mark Dagley 1 Reputation point
    2021-11-15T16:00:28.297+00:00

    Just a thought we have 1 app pool for 100 or so customers could this be that too many do some stuff at the same time?


  3. Mark Dagley 1 Reputation point
    2021-11-17T09:52:16.257+00:00

    so we have managed to get a stack dump from it at last but it only confused us more as the stack dump is not from our code , see below it looks like signal R is calling Raygun which we no longer use and getting stuck in a loop. Does anyone have any ideas ?

    [[HelperMethodFrame]]
    Raygun.Diagnostics.Settings.get_Client()+73
    Raygun.Diagnostics.RaygunTraceListener.WriteMessage(Raygun.Diagnostics.Models.MessageContext)+b2
    System_ni!System.Diagnostics.TraceInternal.TraceEvent(System.Diagnostics.TraceEventType, Int32, System.String, System.Object[])+1e4
    Raygun.Diagnostics.RaygunTraceListener.WriteMessage(Raygun.Diagnostics.Models.MessageContext)+18f
    [[GCFrame]]
    [[GCFrame]]
    [[HelperMethodFrame]]
    Raygun.Diagnostics.Settings.get_Client()+73
    Raygun.Diagnostics.RaygunTraceListener.WriteMessage(Raygun.Diagnostics.Models.MessageContext)+b2
    System_ni!System.Diagnostics.TraceInternal.TraceEvent(System.Diagnostics.TraceEventType, Int32, System.String, System.Object[])+157
    Microsoft.AspNet.SignalR.WebSockets.WebSocketHandler+<>c+<b__13_0>d.MoveNext()+227
    [[HelperMethodFrame]]
    mscorlib_ni!System.Runtime.ExceptionServices.ExceptionDispatchInfo.Throw()+1f
    mscorlib_ni!System.Runtime.CompilerServices.TaskAwaiter.HandleNonSuccessAndDebuggerNotification(System.Threading.Tasks.Task)+3c
    Microsoft.AspNet.SignalR.WebSockets.WebSocketHandler+<>c+<b__13_0>d.MoveNext()+1c0
    System.Runtime.CompilerServices.AsyncTaskMethodBuilder.Start[Microsoft.AspNet.SignalR.WebSockets.WebSocketHandler+<>c+<b__13_0>d, Microsoft.AspNet.SignalR.Core]+76
    Microsoft.AspNet.SignalR.WebSockets.WebSocketHandler+<>c.b__13_0(System.Object)+5f
    Microsoft.AspNet.SignalR.Infrastructure.TaskQueue.InvokeNext(System.Func2, System.Object)+1a Microsoft.AspNet.SignalR.TaskAsyncHelper.FromMethod[[System.__Canon, mscorlib],[System.__Canon, mscorlib],[System.__Canon, mscorlib]](System.Func4, System.__Canon, System.__Canon, System.__Canon)+25
    Microsoft.AspNet.SignalR.Infrastructure.TaskQueue.Enqueue(System.Func`2, System.Object)+1a2
    Microsoft.AspNet.SignalR.WebSockets.WebSocketHandler+d__25.MoveNext()+2c8
    mscorlib_ni!System.Threading.ExecutionContext.RunInternal(System.Threading.ExecutionContext, System.Threading.ContextCallback, System.Object, Boolean)+163
    mscorlib_ni!System.Threading.ExecutionContext.Run(System.Threading.ExecutionContext, System.Threading.ContextCallback, System.Object, Boolean)+14
    mscorlib_ni!System.Runtime.CompilerServices.AsyncMethodBuilderCore+MoveNextRunner.Run()+6c
    System_Web_ni!System.Web.Util.SynchronizationHelper.SafeWrapCallback(System.Action)+6d
    mscorlib_ni!System.Threading.Tasks.Task.Execute()+46
    mscorlib_ni!System.Threading.ExecutionContext.RunInternal(System.Threading.ExecutionContext, System.Threading.ContextCallback, System.Object, Boolean)+163
    mscorlib_ni!System.Threading.ExecutionContext.Run(System.Threading.ExecutionContext, System.Threading.ContextCallback, System.Object, Boolean)+14
    mscorlib_ni!System.Threading.Tasks.Task.ExecuteWithThreadLocal(System.Threading.Tasks.Task ByRef)+215
    mscorlib_ni!System.Threading.Tasks.Task.ExecuteEntry(Boolean)+73
    mscorlib_ni!System.Threading.ThreadPoolWorkQueue.Dispatch()+152
    [[DebuggerU2MCatchHandlerFrame]]
    [[ContextTransitionFrame]]
    [[DebuggerU2MCatchHandlerFrame]]


Your answer

Answers can be marked as Accepted Answers by the question author, which helps users to know the answer solved the author's problem.