SQL Server Reporting Services
A SQL Server technology that supports the creation, management, and delivery of both traditional, paper-oriented reports and interactive, web-based reports.
3,061 questions
This browser is no longer supported.
Upgrade to Microsoft Edge to take advantage of the latest features, security updates, and technical support.
' cx='32' cy='32' r='32' /%3E%3Ctext x='50%25' y='55%25' dominant-baseline='middle' text-anchor='middle' fill='%23FFF' %3ED%3C/text%3E%3C/svg%3E)
hi we run 2014 enterprise. we are going to 2019 in the coming months.
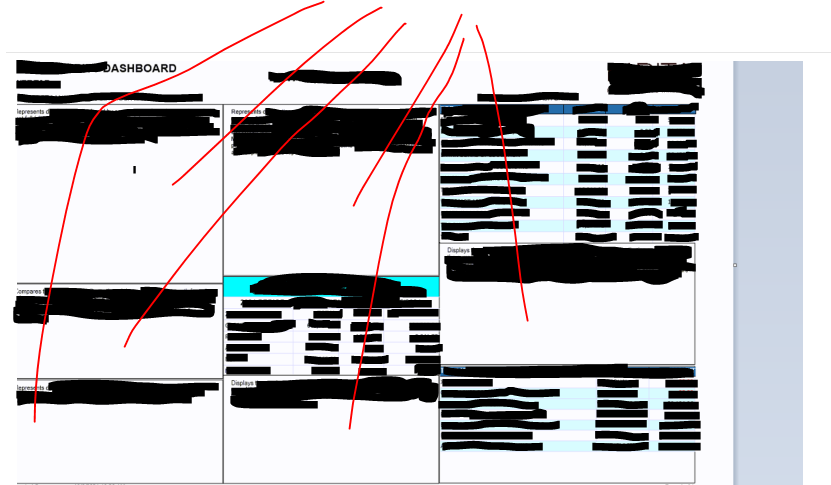
we have one dashboard style report with about 6 charts and 2 rectangles. the 2 rectangles each have their own tablix.
we will try to trap this in the log next time it happens but on occasion just the charts render with the hover over text in the graphic instead of the chart. any ideas?
' cx='32' cy='32' r='32' /%3E%3Ctext x='50%25' y='55%25' dominant-baseline='middle' text-anchor='middle' fill='%23FFF' %3EI1%3C/text%3E%3C/svg%3E)
Hi @db042190 ,

what is the log,and how did you trap the report ? I am not sure what you want to accomplish,can you descibe more detail?
Best Regards,
Isabella
If the answer is helpful, please click "Accept Answer" and upvote it.
Note: Please follow the steps in our documentation to enable e-mail notifications if you want to receive the related email notification for this thread.
what is the log,and how did you trap the report ? I am not sure what you want to accomplish,can you descibe more detail?
thx isabella. the log is Program Files\Microsoft SQL Server\MSRS12.MSSQLSERVER\Reporting Services\LogFiles where presumably some error would be posted the same time this happens. since our logs stick around for 30 days, we have 30 days to "trap" or see the error. once 30 days passes, we dont have a clue and we have to wait till the next time it happens.
assume you have a chart region hover over that reads "this chart represents year over year sales comparisons for the last 10 years". But instead of your chart's bars rendering in that region, your hover over message renders in that region as if its a textbox. that's what is happening to us on occasion. what we want to accomplish is to determine why. once we determine why (under what conditions is that even possible), maybe we can come up with a solution.
Hi @db042190
I'm not clear of what you want to accomplish,only if your report open with some error,we need to check the log,but if your report open successfully,you don’t need to check the log.
Can you show your report designed screenshot ,and how it looks like,and what you expert it to be like.
thx isabella. i will post redacted pictures. the assumption is that when ssrs renders something in a chart region that it isnt supposed to (in this case a string) instead of a chart, that the log will show some timeout or space errors or warnings.
when this report works, the regions being pointed to by red lines render various bar charts. as you can see when the problem occurs, instead of a chart we get the full text of the associated hover over tip instead.
Hi @db042190 ,
Is the chart with some error,can you create a new report ,and show one of the disappeared chart ,to check if the chart has some error which prevent it from showing.
Can you show us the detailed error log
thx isabella, i cannot create a new report but below is what we believe to be an error log from the last time this happened.
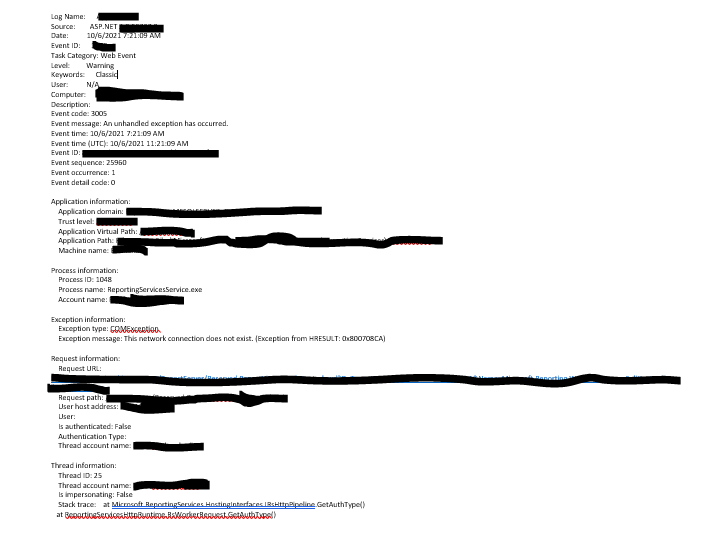
Hi @db042190 ,
It seems there is some network connection error.
Please check a look at this thread :
https://www.reddit.com/r/Windows10/comments/5fjkfa/solution_this_network_connection_does_not_exist/