' cx='32' cy='32' r='32' /%3E%3Ctext x='50%25' y='55%25' dominant-baseline='middle' text-anchor='middle' fill='%23FFF' %3EMM%3C/text%3E%3C/svg%3E)
11,582 questions

' cx='32' cy='32' r='32' /%3E%3Ctext x='50%25' y='55%25' dominant-baseline='middle' text-anchor='middle' fill='%23FFF' %3EMM%3C/text%3E%3C/svg%3E)
Thank you for your interest in my question...
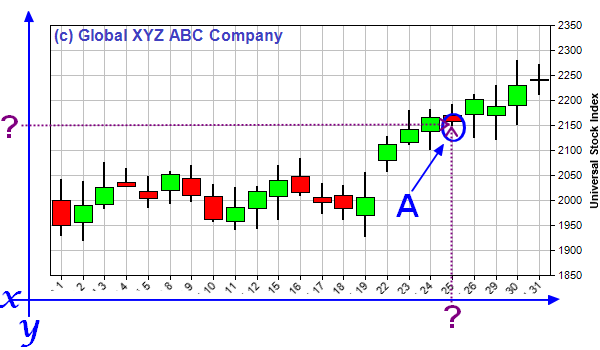
On this chart, to retrieve the value of Y for candle 25, I do :
DataPoint Right = chart.series[0].Popints[25];
LinbeAnnotation line = new LineAnnotation();
line.Y = right.YValues[1]; (0=High, 1=Low, 2=Open,3=Close)
line.Y = 2150 (you can see it on AxisY2 and X = 25...
But i would like to get the coordonate of the low point (in purple on my picture) but i don't know how to do.
I searched here (i m french ) https://learn.microsoft.com/fr-fr/dotnet/api/system.web.ui.datavisualization.charting.datapoint?view=netframework-4.8 but i don't understand how to find the high and low value..
Sorry but i m a beginner...