Azure Monitor
An Azure service that is used to collect, analyze, and act on telemetry data from Azure and on-premises environments.
This browser is no longer supported.
Upgrade to Microsoft Edge to take advantage of the latest features, security updates, and technical support.

I am trying to find good examples or information if it's possible to use say Azure Monitor through log analytics to monitor high cpu on a specific process on Linux. I have seen good examples for windows with specific performance counters in Log Analytics, but nothing great for Linux. Is this possible for linux and if so how did you do it? I am wanting to say monitor omiagent for OMS if it takes up high amount of CPU to alert out. I have issues where it can take up a CPU core and I have to recycle the omiagent with sudo /opt/omi/bin/service_control restart.
Any help or information is greatly appreciated as I am having hard time finding good information for linux process monitoring for such things as high CPU usage
Thanks
Seems you can't do this natively with Azure Monitor default metrics that I see. You can however, do this with telegraf via procstat plugin. https://github.com/influxdata/telegraf/blob/master/plugins/inputs/procstat/README.md .... I won't explain how to setup telegraf as there is already guides out there but if its setup properly and you do this, it'll be working.
I configured it like so
[[inputs.procstat]]
[[inputs.procstat]]
exe = "omiagent"
prefix = "omiagent"
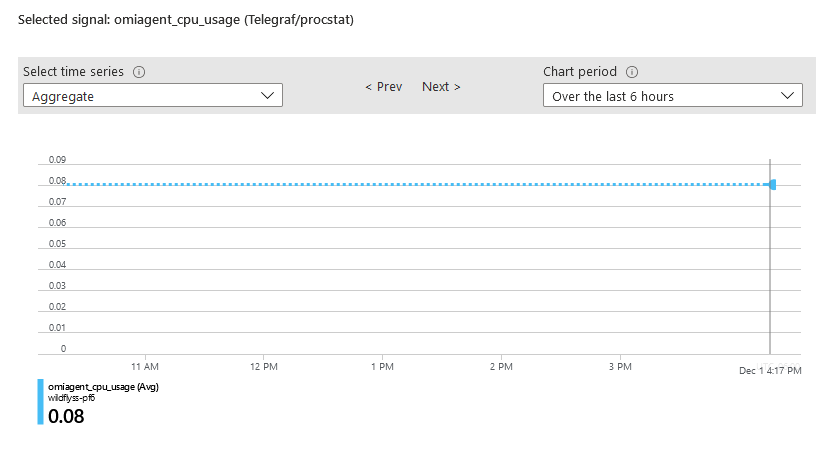
This now shows omi agent cpu_usage data for that process which I can now monitor and set alerts for specific thresholds