Azure Data Factory
An Azure service for ingesting, preparing, and transforming data at scale.
10,786 questions
This browser is no longer supported.
Upgrade to Microsoft Edge to take advantage of the latest features, security updates, and technical support.
' cx='32' cy='32' r='32' /%3E%3Ctext x='50%25' y='55%25' dominant-baseline='middle' text-anchor='middle' fill='%23FFF' %3EVI%3C/text%3E%3C/svg%3E)
Hello All, Context: We are using ADF to move data into Cosmos. For certain tables, we are recreating the container (more like full load of data). While doing so, we are setting the throughput for the container.
Now we are looking for the throughput configured for a given run in the past (as the throughput value has gone through some changes).
Here is what we are looking for and haven't had any luck with google search:
' cx='32' cy='32' r='32' /%3E%3Ctext x='50%25' y='55%25' dominant-baseline='middle' text-anchor='middle' fill='%23FFF' %3EMM%3C/text%3E%3C/svg%3E)
@Vignesh Iyer did my response help you? If it solved your issue, please mark as accepted answer, otherwise let me know how I may better assist.
Hello @Vignesh Iyer and welcome to Microsoft Q&A! I hope this will be a good first experience.
So detail like parallel copies, DIU used, and time taken, can be found in the input/output of an activity run. As a proof of concept, go to the monitoring tab, and select a pipeline run for a pipeline which used a copy activity. Hover mouse between "Activity Name" and "Activity Type", and some options will appear as in below picture.
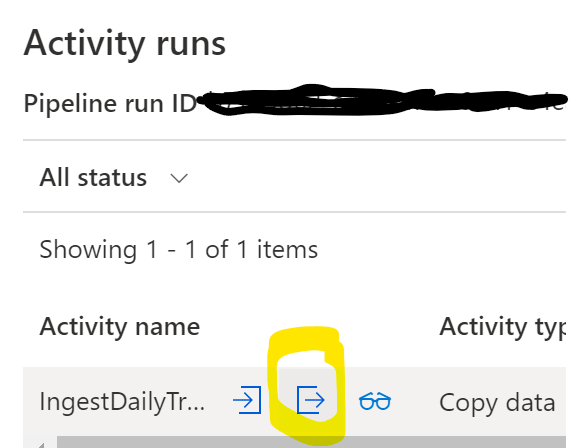
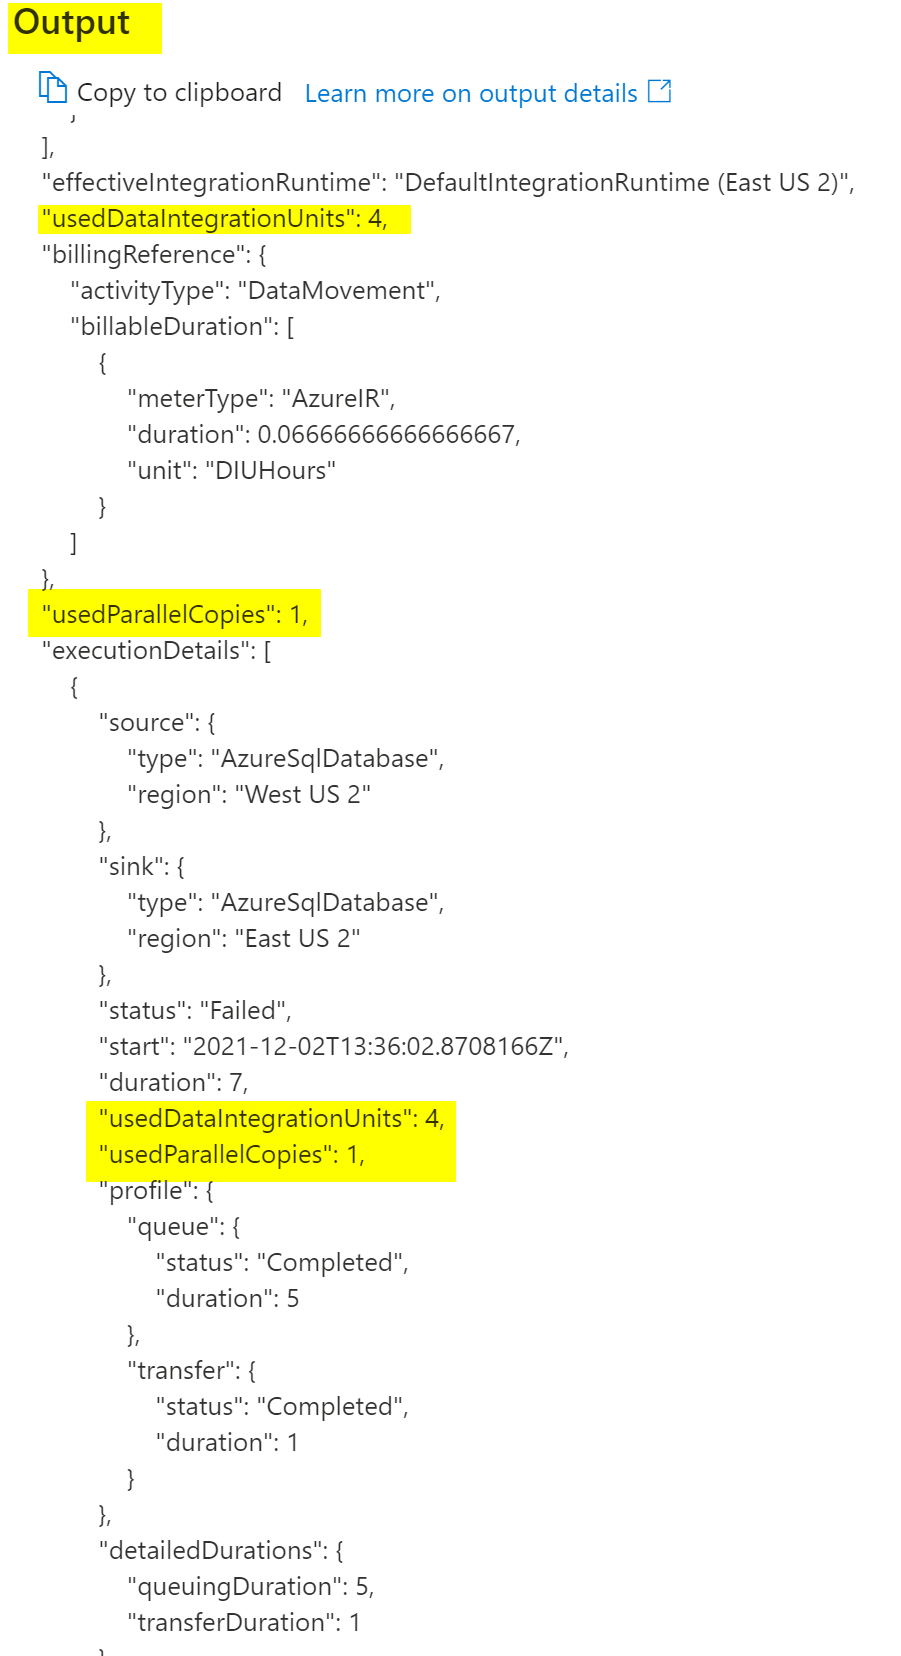
The arrow-leaving-box button is for "Output" and contains the info I think you are looking for. In my particular example, I have a failed copy from SQL, but the details are still there. See below image.
Once you have confirmed these are the sort of things you are looking for, I can elaborate on other ways to fetch the same details. These include powershell or rest api. I think (80% certain) these are also available in Log Analytics.
Thanks for the details Martin. This does help with part of the information that we are looking at. We are still unable to get the throughput details set for Cosmos Container while recreating it from ADF. Any thoughts on how we can get that?
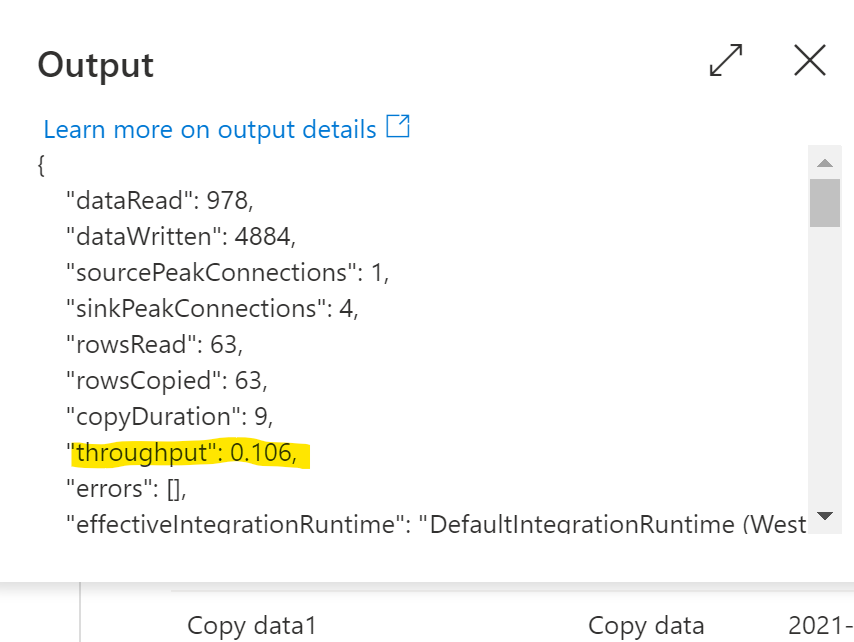
In writing to a Cosmos Mongo, I was able to see a throughput in the output. @Vignesh Iyer See below image.