1,104 questions
Make sure that the saspiwpr project is generating a PDB. Check the linker properties linker-property-pages
This browser is no longer supported.
Upgrade to Microsoft Edge to take advantage of the latest features, security updates, and technical support.
' cx='32' cy='32' r='32' /%3E%3Ctext x='50%25' y='55%25' dominant-baseline='middle' text-anchor='middle' fill='%23FFF' %3ECW%3C/text%3E%3C/svg%3E)
Hi experts,
I am new with VS environment, and I am being asked to take over a product developed in VS.
There are multiple projects in C++ for the solution I am working with VS2019. The starting project TestConsole has dependencies on another project (saspiwpr) under the same solution. The problem I am having is unable to step into function in saspiwpr from TestConsole. I did googling and did the following:
Still not able to step into the source code, but get a prompt to step into assembly code instead.
Is there anything else I should do in order to solve this problem?
Thanks a lot for your help!
-Cindy
' cx='32' cy='32' r='32' /%3E%3Ctext x='50%25' y='55%25' dominant-baseline='middle' text-anchor='middle' fill='%23FFF' %3EDL%3C/text%3E%3C/svg%3E)
Are both projects native C++ ones (not managed code)?
If when debugging you examine the modules pane (Debug, Windows, Modules) what does it show for the Symbol File for your DLL?
' cx='32' cy='32' r='32' /%3E%3Ctext x='50%25' y='55%25' dominant-baseline='middle' text-anchor='middle' fill='%23FFF' %3ETS%3C/text%3E%3C/svg%3E)
Hi @Cindy Wang , while debugging, you can click Debug > Windows > Modules, and make sure that the specific modules/symbols are loaded correctly. Besides, is it possible for you to share some minimal example/key codes for reproducing this issue?

Another general step to consider is to create a new solution with a DLL project and an Application project that consumes the DLL.
Lets assume that after you build the solution for x64 Debug the debugger is able to step into the DLL source code. You could then compare the project files (.vcxproj) in the test solution to the problematic projects to look for any unexpected differences in project properties.
Thanks for your response David!
I looked the modules pane while debugging TestConsole, and saspiwpr.dll is not being listed there. So the question is how would I add that?
Thanks again for your help!
-Cindy
Thanks for your response Tianyu!
I looked the modules pane while debugging TestConsole, and saspiwpr.dll is not being listed there. So the question is how would I add that?
The example is TestConsole calls a function in saspiwpr, where both TestConsole and saspiwpr are in C++ and under the same location.
Thanks again for your help!
-Cindy
If the modules pane does not show saspiwpr.dll then how do you know that the prompt to step into assembly code is for that dll?
If it's lot listed there, it hasn't been loaded, so it's no wonder you can't step into it.
I think there's some detail of your situation that we're missing because this scenario shouldn't be a problem.
And if TestConsole uses load time linking for the dll then an inability to load it would result in the application not starting. So I agree, there's definitely a disconnect somewhere.
You are right. It is no longer stepping into assembly code since I made some changes. I am not sure what changes I made caused that though.
Is there a way to add the module? Everything runs to completion as expected,, just the debugging is not working still.
Thanks!
-Cindy
I gave the wrong information.
So the saspiwpi.dll was not listed when the program was firsted started, but as I continue to run the program, it gets listed under the modules:
saspiwpr.dll saspiwpr.dll C:\pp_dbipiaf_v940m8\PISystem\x64\Debug\saspiwpr.dll N/A Yes Symbols loaded. C:\pp_dbipiaf_v940m8\PISystem\x64\Debug\saspiwpr.pdb 7 9.40 12/6/2021 9:41 PM 00007FFFA3530000-00007FFFA3564000 [24724] TestConsole.exe
Sorry about the confusion. As you know, I am very new to VS environment and on my learning curve still.
Thanks!
-Cindy
OK, so it sounds like it's being dynamically loaded - and VS appears to have the symbols for it.
When it's in that loaded state, can you open the source for that project and put a breakpoint in that will be hit?
yeah, you are right. It is loaded by LoadLibrary() call. I tried to set a break point after it is being loaded, but the break point indicates that "The breakpoint will not currently be hit. No executable code of the debugger's target code type is associated with this line".
Thanks!
-Cindy
I'm guessing, but it seems to me that the DLL that's loaded (and you have symbols for) isn't perhaps the same version as the source code.
It is a debug build (without optimization) with full symbol information that you're building for that DLL, isn't it?
Have you tried placing breakpoints at lots of other lines of code in that DLL (including lines that don't appear to have code) to see if any of them stick?
Presumably you have the source code and the dll project that you could use to rebuild the dll. That would ensure that the debugging information and the new symbol file would match the source code used to rebuild the dll.
I tried to clean the solution and rebuild the solution, and also tried multiple break points after the dll is being loaded, but still can't make it to work.
I also checked saspiwpr.dll (being loaded by TestConsole) was built for debug, and both saspiwpr.dll and saspiwpr.pdb are under the debug path under which TestConsole.exe is found:
C:\playpen\piSolution\x64\Debug
Thanks!
-Cindy
C:\pp_dbipiaf_v940m8\PISystem\x64\Debug\saspiwpr.dll
That was the file system location you previously posted for the dll.
Now you say you are using the saspiwpr.dll that is located here -
C:\playpen\piSolution\x64\Debug
So again, it is not clear what version of the dll you may have rebuilt and what version is actually loading while debugging.
Sorry for the confusion. It is the same path. I modified the name to make it look more simple.
Thanks!
-Cindy
Check the the call to the LoadLibrary function in the TestConsole source code. Does it include a path to saspiwpr.dll?
It does not include the path:
lib = LoadLibrary (L"saspiwpr.dll");
Set a break point in TestConsole.exe on the statement immediately following the call to LoadLibrary. At that point the dll should be loaded and you should see it in the modules pane. If the modules pane indicates that the symbol file has not been loaded right click on the dll line and try to manually load the symbol file. You should also be able to verify that the file system location of the loaded dll is correct.
I set a break point right after the call to LoadLibrary as you suggested. And the modules pane indicates that the symbol file has been loaded:
saspiwpr.dll saspiwpr.dll C:\pp_dbipiaf_v940m8\PISystem\x64\Debug\saspiwpr.dll N/A Yes Symbols loaded. C:\pp_dbipiaf_v940m8\PISystem\x64\Debug\saspiwpr.pdb 7 9.40 12/8/2021 2:44 PM 00007FFFA2A30000-00007FFFA2A64000 [10372] TestConsole.exe
And the path seems correct too.
Thanks for your suggestions!
-Cindy
Okay, since both the dll and its symbol file are loaded you should be able to set a breakpoint in the dlls source code. Have you tried to do this?
If you are still unable to set a break point in the dlls source code go to the project properties of the dll and tell us what is set for the format of the debugging information in the compiler options.
I tried to set break point, but it indicated that:
"The breakpoint will not currently be hit. No executable code of the debugger's target code type is associated with this line"
Where can I find the compiler options?
Thanks!
-Cindy
Instructions for finding the project property setting are here
The debug information format is: Program Database (/Zi)
That was the format setting for all platform / configurations?
yes, that is for all configurations and all platforms.
Also please verify that even though you are building the dll in the debug configuration that compiler optimization is actually disabled. Check the dll project property here
od-disable-debug
The optimization shows: <different options> .
What does it show for optimization specifically for x64 debug?
It shows Disabled for Debug/x64.
Well, at this point I don't know what else to ask you. According to all your responses I can think of no reason why you are unable to set a break point in the dll source code.
Can you share with us a sample that reproduces the issue?
Make sure that the saspiwpr project is generating a PDB. Check the linker properties linker-property-pages
Thanks for your response RLWA32-6255!
I just checked that the property for saspiwpr project-->linker-->debugging:
Generate Debug Information is already set to be: Generate Debug Information (/DEBUG)
-Cindy
Properties can be set individually for different combinations of platform/configuration. So verify that the debug properties that you checked were in fact for the x64 platform.
Also, check the debugger options for symbol files to ensure that the debugger is configured to load them for all modules. These settings are not project properties but are visual studio IDE options.
I checked, and it is for all Platforms and configuration of DEBUG.
I took a screen shot of the tools-->options-->Debugging which I am attaching. It looks like it loads for all modules.
Thanks!
-Cindy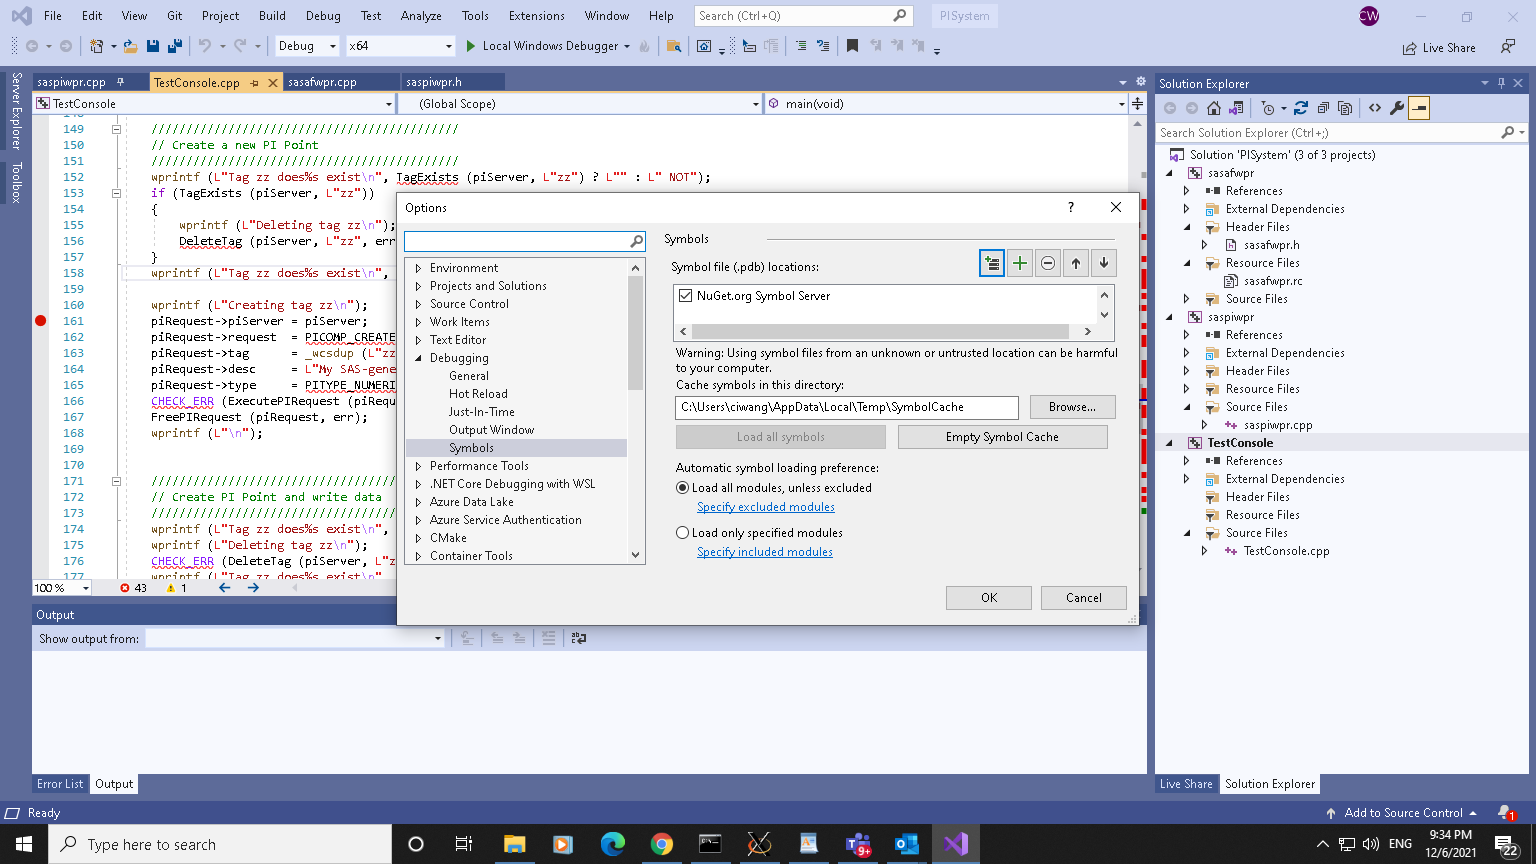
Have you looked in the output directories for your projects to verify that they do contain the symbol files for your projects?
Another project property to check is the debug information format and compiler options.