Not Monitored
Tag not monitored by Microsoft.
42,090 questions
This browser is no longer supported.
Upgrade to Microsoft Edge to take advantage of the latest features, security updates, and technical support.
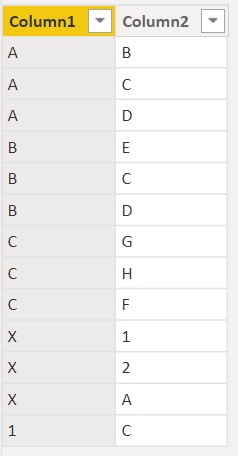
I'm looking for a graph that shows the details of my data shown in this example :

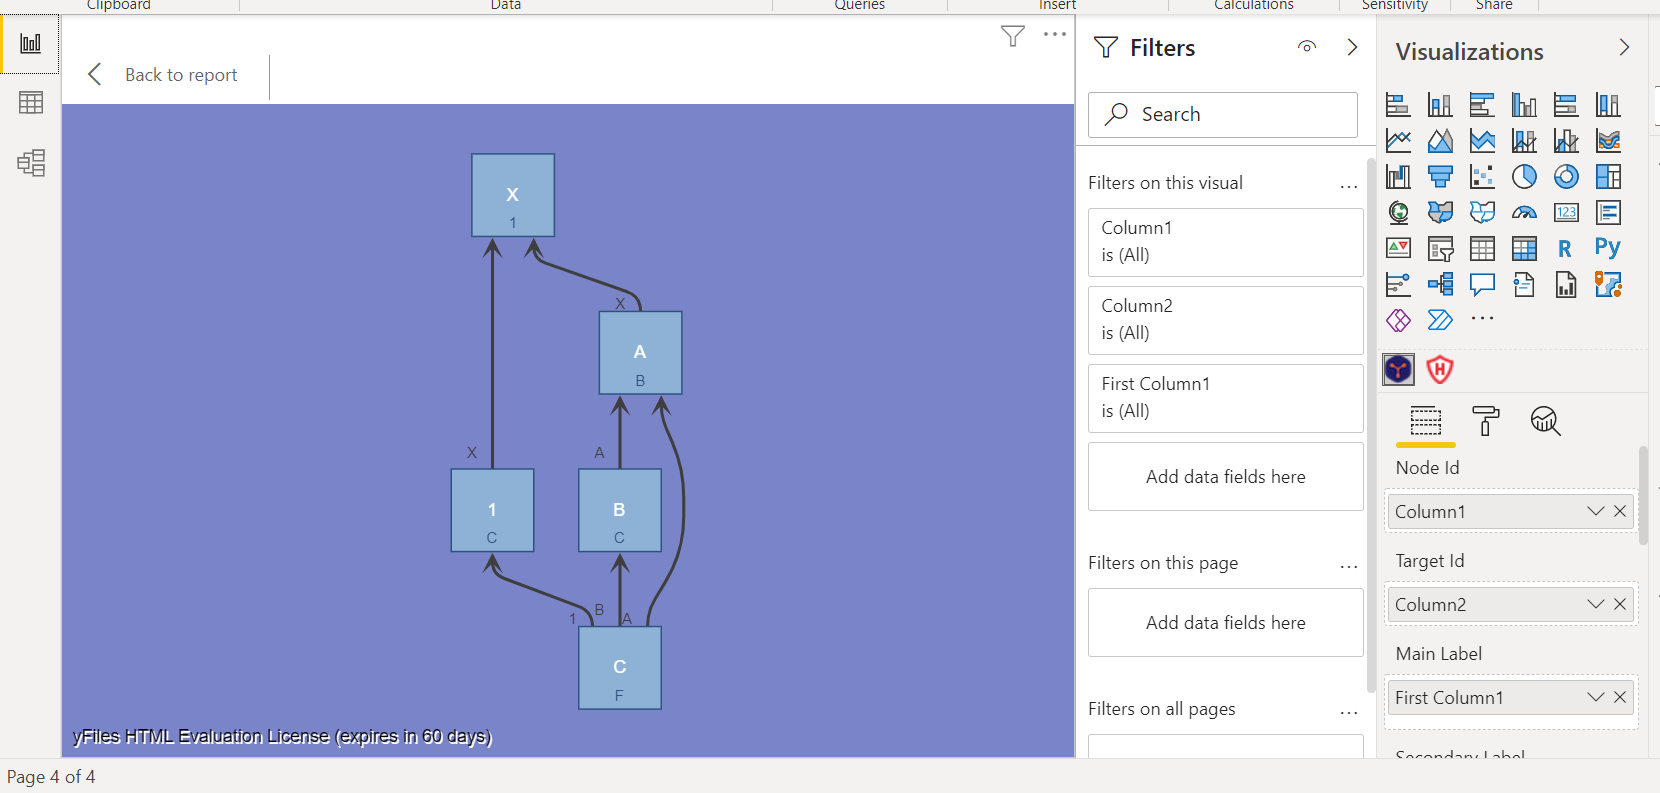
I tried this code but it give me only the sources that have targets :
https://github.com/yWorks/graphs-in-power-bi
