Exel Pivot Table and Chart

Flinn, Randal J 281 Reputation points
2022-01-03T20:22:12.09+00:00

Hello,

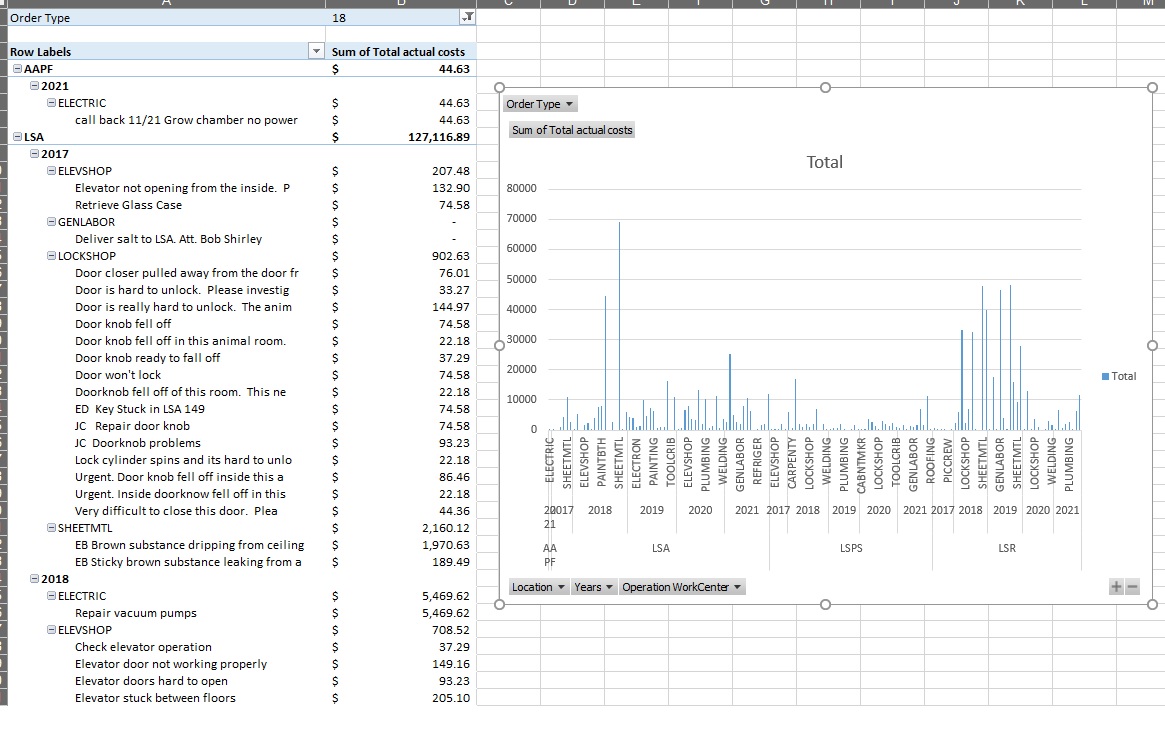
Is it possible to display data in a Pivot table and not display in the associated Pivot Chart? I have a description field that is appropriate to review in the table but merely clutters the chart.

Thank You

Office Development
Office Development
Office: A suite of Microsoft productivity software that supports common business tasks, including word processing, email, presentations, and data management and analysis.Development: The process of researching, productizing, and refining new or existing technologies.
3,994 questions
Excel Management
Excel Management
Excel: A family of Microsoft spreadsheet software with tools for analyzing, charting, and communicating data.Management: The act or process of organizing, handling, directing or controlling something.
1,728 questions
0 comments No comments
{count} votes

2 answers

Sort by: Most helpful
  1. Emily Hua-MSFT 27,651 Reputation points
    2022-01-04T08:40:52.44+00:00

    Hi @Flinn, Randal J

    According to your description, I would suggest you unshare a data cache between PivotTable reports.
    But please note, this action would take up more computer hardware resources, such as memory.
    For more, please refer to 'Unshare a data cache between PivotTable reports'.

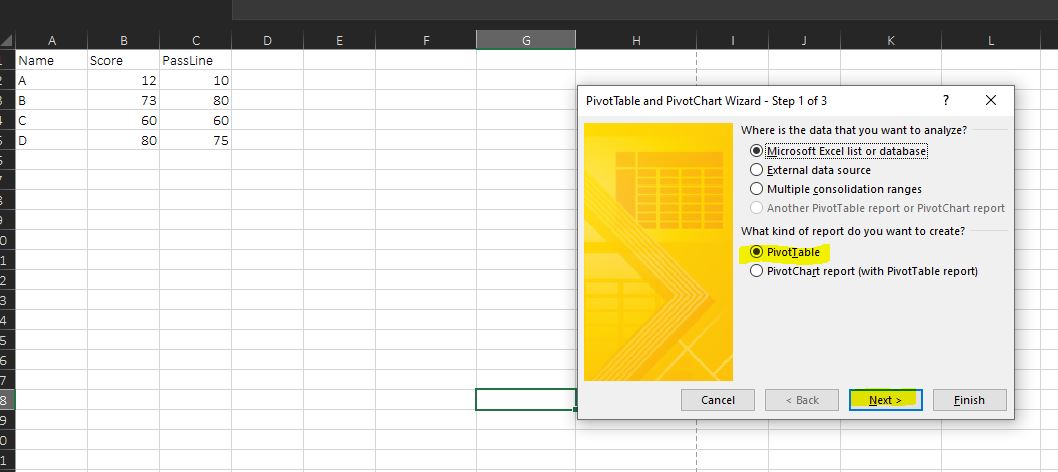
    1 To create an absolute Pivot Table, please press Alt and D at the same time, then please release them and press P key to open PivotTable and PivotChart Wizard.

    • Please select "Microsoft Excel list or database" and "Pivot Table", then select "Next".
      162088-capture106.jpg
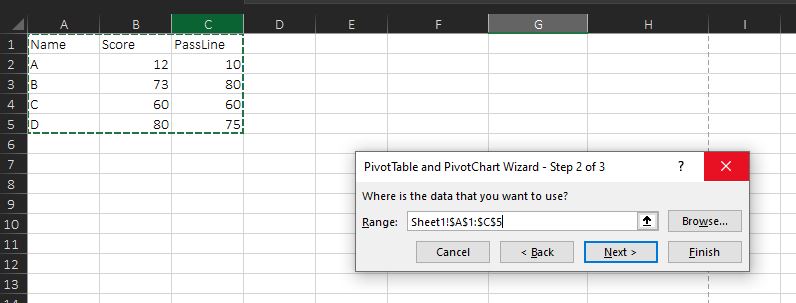
    • Choose the correct data source range to create one Pivot Table, then click "Next".
      162097-capture107.jpg
    • Choose the range to show this Pivot Table.

    2 To create an absolute Pivot Chart, you still need to use PivotTable and PivotChart Wizard.

    • But please note, at step 1, you need to select "PivotChart report (with PivotTable report)".
      162098-capture108.jpg
    • Then please choose the data range source, click "Next". If you get the following message, please click "Yes".
      162173-capture109.jpg
    • Choose the PivotTable name, click "Next".
      162100-capture110.jpg
    • Choose one range to show this PivotChart.

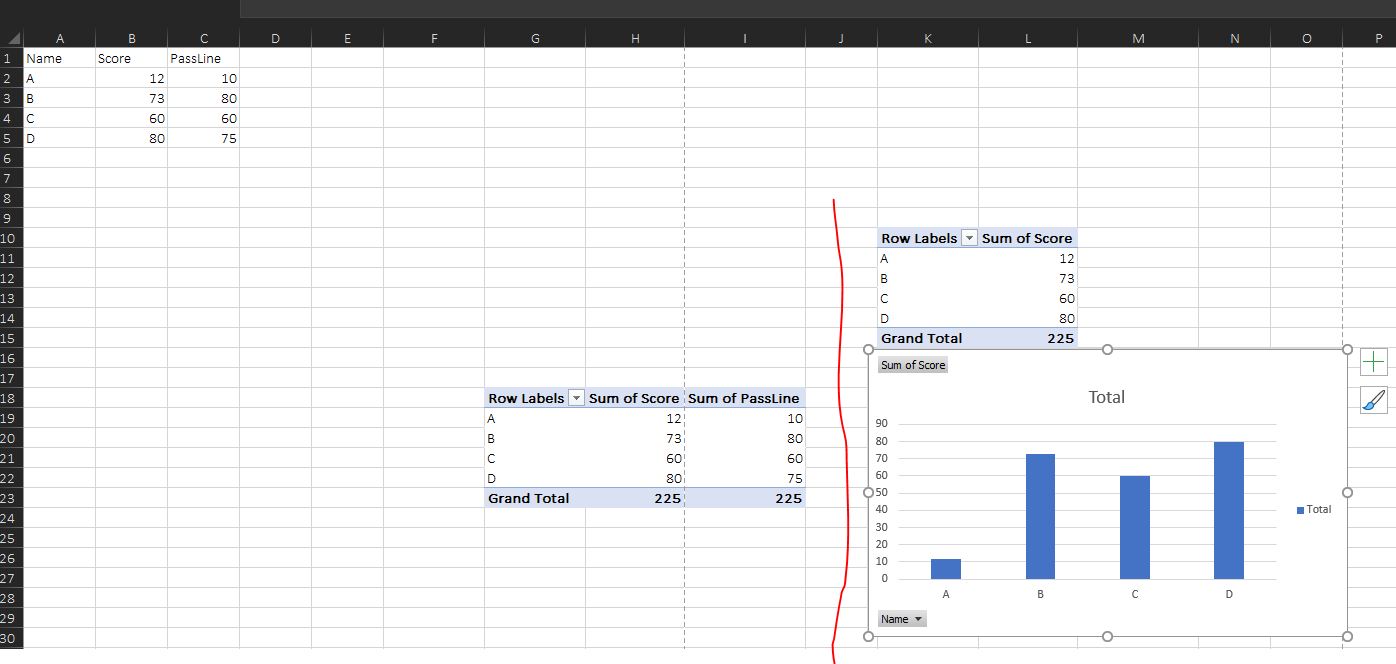
    3 At last, you would find a result like following image. The data fields are different between PivotTable and PivotChart.
    162175-capture111.jpg
    If needed, you could delete the second PivotTable.


    If the answer is helpful, please click "Accept Answer" and kindly upvote it. If you have extra questions about this answer, please click "Comment".
    Note: Please follow the steps in our documentation to enable e-mail notifications if you want to receive the related email notification for this thread.

    0 comments No comments

  2. Flinn, Randal J 281 Reputation points
    2022-01-05T16:30:37.873+00:00

    Hi @Emily Hua-MSFT

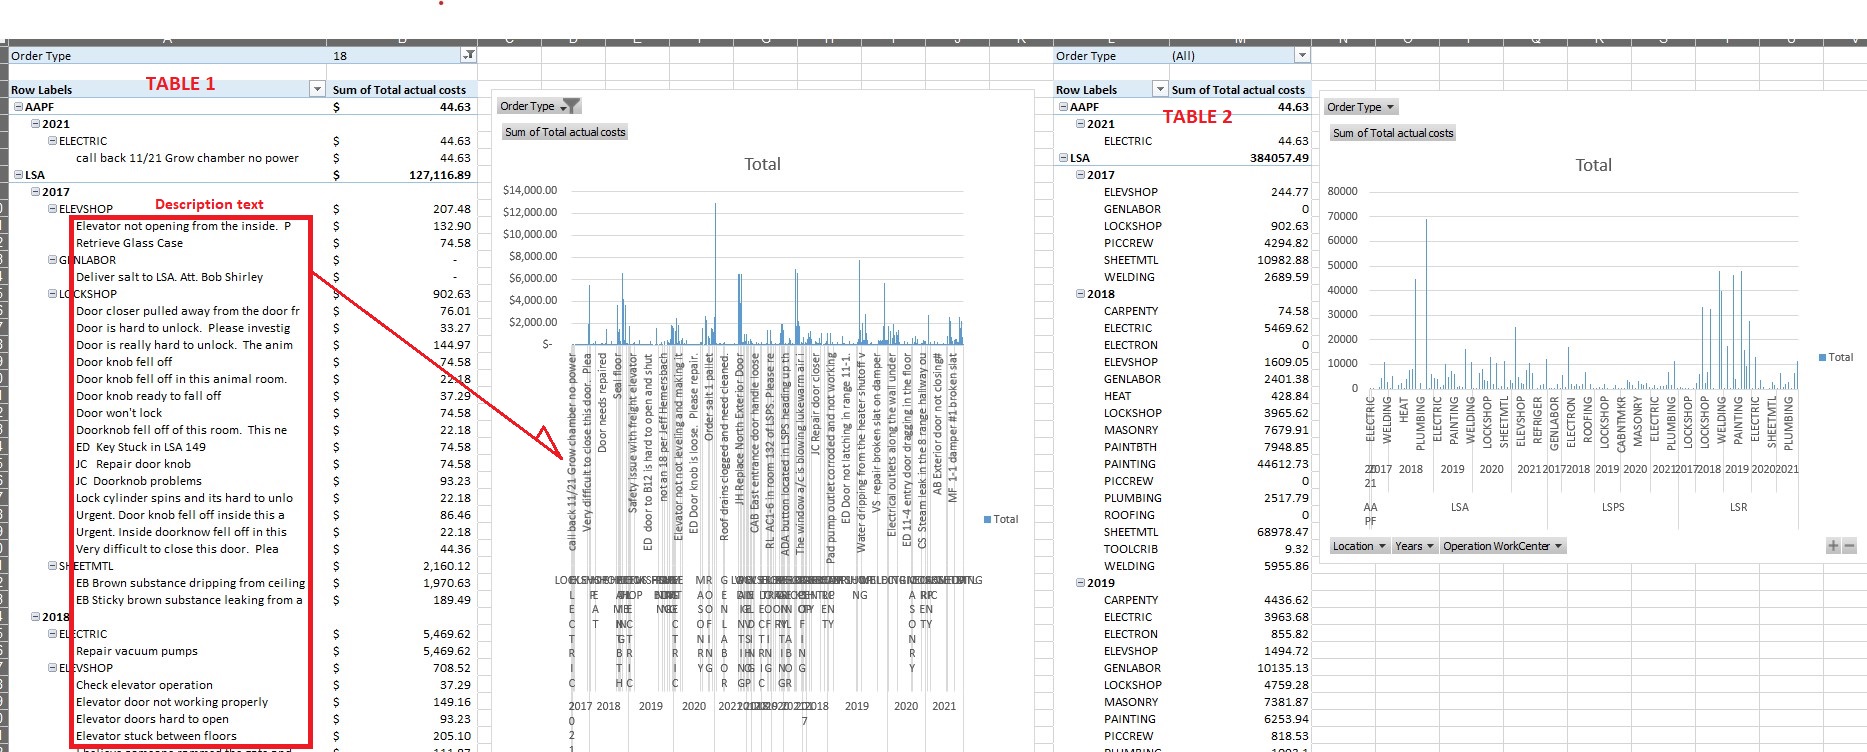
    I have completed your suggestion and read the information from the link you provided; however, I'm not sure I fully understand. It appears I must have both tables visible to see the "Description" text (from Table 1) and use Table 2 to modify the Chart. Is that accurate or am I missing something?

    162527-snip1.jpg

    Essentially what I want to see is the following...

    162568-snip2.jpg


Your answer

Answers can be marked as Accepted Answers by the question author, which helps users to know the answer solved the author's problem.