Azure Monitor
An Azure service that is used to collect, analyze, and act on telemetry data from Azure and on-premises environments.
3,645 questions
This browser is no longer supported.
Upgrade to Microsoft Edge to take advantage of the latest features, security updates, and technical support.
' cx='32' cy='32' r='32' /%3E%3Ctext x='50%25' y='55%25' dominant-baseline='middle' text-anchor='middle' fill='%23FFF' %3EMJ%3C/text%3E%3C/svg%3E)
Hi,
I am trying to configure the Application Insights in my Java Application. The logs are going into the Application Isights, but it doesn't capture all the info from the logs like method name, line number etc.
For example,
actual log from application,
01:33:21 main INFO org.hibernate.Version logVersion:44 - HHH000412: Hibernate ORM core version 5.4.17.Final
Logs going into the Application Insights.
{"ver":1,"name":"Message","time":"2022-01-19T01:33:21.84Z","iKey":"79711330-d3a7-45f0-bec4-ee9489ae28bb","tags":{"ai.internal.sdkVersion":"java:3.2.4","ai.cloud.role":"RunId:-703","ai.operation.id":"663549a66c4997600ced2a378044a48d","ai.cloud.roleInstance":"adds"},"data":{"baseType":"MessageData","baseData":{"ver":2,"message":"HHH000412: Hibernate ORM core version 5.4.17.Final","severityLevel":"Information","properties":{"fileName":"BatchRunExecutor-qj08102838","LoggerName":"org.hibernate.Version","LoggingLevel":"INFO","SourceType":"Logger","ThreadName":"main","dirName":"nodir"}}}}
It is missing the method name, line number etc. So How to enforce Application Insights to capture all these info.
I am using applicationinsights-agent-3.2.4.jar to push the logs.
Thanks in advance for the help
' cx='32' cy='32' r='32' /%3E%3Ctext x='50%25' y='55%25' dominant-baseline='middle' text-anchor='middle' fill='%23FFF' %3EMM%3C/text%3E%3C/svg%3E)
@Manayath, Jovin - Thanks for reaching out to us and for being patient.
Apologies for delay in response. I am currently working with Product team on this issue and will get back to you as soon as I hear back from them.
Thank you again for your patience and cooperation.
@Manayath, Jovin - Did the below answer help resolve your issue, if not please revert back with any questions.
and if it did, please feel free to "accept as answer" so it can be beneficial to the community.

Hi @Manayath, Jovin ,
Per Application Insights nomenclature, the trace event you are looking at is just a quick message (string) that has no details like class/method names, performance measurements, or any similar information. While it is possible to append any extra details to the log message body itself, doing so today would be a responsibility of the logging code.
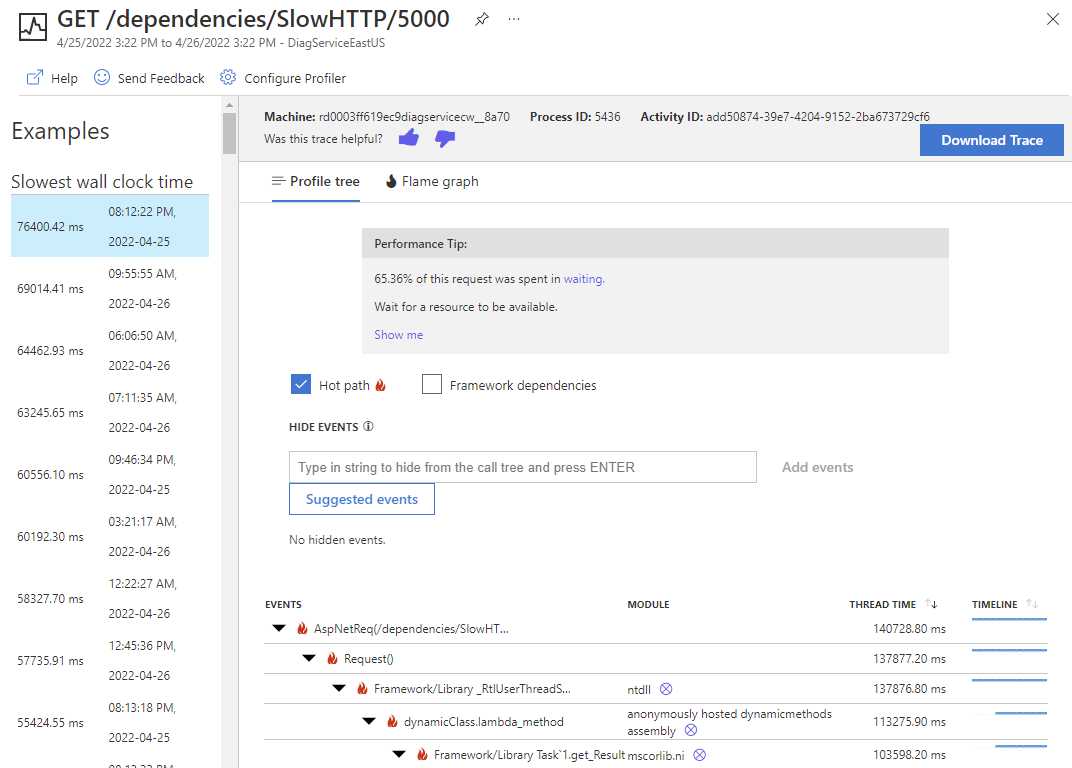
At the same time, the code-level details that you are describing are represented by Application Insights Performance Profiler traces. We currently collect them for the .NET apps; capturing Java profiler traces is on the roadmap and will be available in the future. If you want to join our early private preview, please register at aka.ms/JavaO11y. We will notify you when preview for Java becomes available.
Thank you,
Vitaly Gorbenko
Application Insights PM