Azure SQL Database
An Azure relational database service.
6,338 questions
This browser is no longer supported.
Upgrade to Microsoft Edge to take advantage of the latest features, security updates, and technical support.
' cx='32' cy='32' r='32' /%3E%3Ctext x='50%25' y='55%25' dominant-baseline='middle' text-anchor='middle' fill='%23FFF' %3EAN%3C/text%3E%3C/svg%3E)
I have a .NET Core Azure Functions App hosted on an App Service plan inside App Service Environment (ASE v2). The plan is on isolated I2 pricing tier. The Functions app has Always On setting turned on. For some reason, the app is having slowness issues connecting to Azure SQL database. The database is running on same region as the Functions app and has Business Critical pricing tier.
I am seeing in Application Insights that API calls are taking seconds to finish because the codepath is busy waiting to get an SQL connection. The actual database operations finish within milliseconds.
I have ran the app locally with database connection strings set to the Azure SQL databases and saw no delay at all. Each requests finished within milliseconds. Then I created a new Azure Functions app outside existing App Service Environment with a dedicated App Service plan. The result is the same, no delay at all.
Is there some missing configuration that is causing this slowness in App Service Environment? I tried to use tcpping to get latency amount to Azure SQL database, but the connection keeps timing out on ASE app. But it works fine on the kudu console of the non-ASE app.
' cx='32' cy='32' r='32' /%3E%3Ctext x='50%25' y='55%25' dominant-baseline='middle' text-anchor='middle' fill='%23FFF' %3EMM%3C/text%3E%3C/svg%3E)
Thanks for reaching out to Q&A.
I would suggest you to look into the Diagnose and solve problems blade available in the portal to check the health of the ASE. Also the detector "Availability and Performance" will give you some additional insights about the performance delay.
As you have already enabled App insights, you can look into the performance counters to analyze the latency further. From the code perspective, try add some timer logging so that you can identify which part of the code is taking longer time to execute. However the same code runs faster in a non-ASE SKU which means the problem might not be with the code.
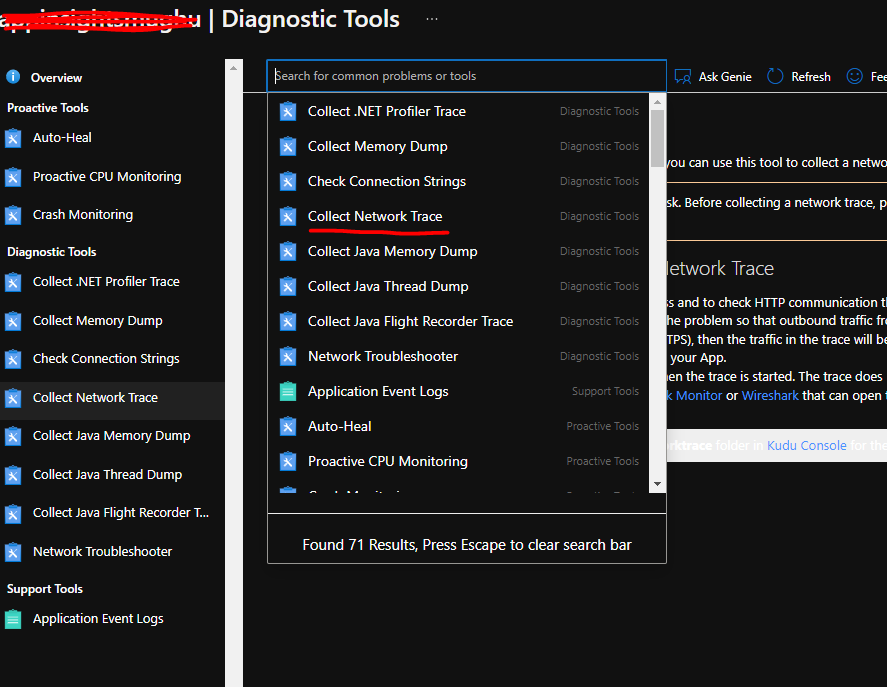
Strange observation is that the tcpping to SQL fails from the ASE Kudu site, this means that there is a problem with the network connectivity however if there is a network connectivity issue, the app wont even communciate with SQL. In your case, the app communicates and there is a latency. You can collect a network trace in the same Diagnose and solve section, search for "Collect network trace" and you will see that detector
@Asiful Nobel , Just wanted to know if the above answer was helpful or not. Please let me know