Azure Monitor
An Azure service that is used to collect, analyze, and act on telemetry data from Azure and on-premises environments.
This browser is no longer supported.
Upgrade to Microsoft Edge to take advantage of the latest features, security updates, and technical support.
' cx='32' cy='32' r='32' /%3E%3Ctext x='50%25' y='55%25' dominant-baseline='middle' text-anchor='middle' fill='%23FFF' %3ENK%3C/text%3E%3C/svg%3E)
Hi,
I have a nodejs backend application which is instrumented with the application insights. The logs and metrics are getting pushed to Application insights from my application but where as when an exception occurs in my nodejs application, it is logged in application insights exception table with library level exception rather than actual exception as seen in nodejs application console.
The instrumented code sample of app insights is as below:
const appInsights = require('applicationinsights') //Imported at the beginning of my application's index.js file

appInsights.setup(config.AI_CONNECTION_STRING)
  .setAutoCollectConsole(true, true)
  .setSendLiveMetrics(true)
  .setAutoCollectRequests(true)
  .setAutoCollectPerformance(true, true)
  .setAutoCollectExceptions(true)
  .setDistributedTracingMode(appInsights.DistributedTracingModes.AI)
  .start()
The actual stacktrace occured in nodejs application is as below:
07:47:57.605Z ERROR test-device-management: Error handling request
  Error: The device reference does not exist
      at new BaseException (/Users/Desktop/test-repo/test-device-management/services/test-device-management/node_modules/@test/test-service-builder/src/common/HTTPErrors.js:9:11)
      at new NotFoundException (/Users/Desktop/test-repo/test-device-management/services/test-device-management/node_modules/@test/test-service-builder/src/common/HTTPErrors.js:64:5)
      at Object.handleSequelizeError (/Users/Desktop/test-repo/test-device-management/services/test-device-management/node_modules/@test/test-common-db-sequelize/src/errors/SequelizeErrors.js:46:14)
      at async DeviceController.readOne (/Users/Desktop/test-repo/test-device-management/services/test-device-management/src/common/CrudBaseController.js:42:18)
But the Stacktrace and exception as seen in application insights exception table is as below:
Error:
   at NodeClient.TelemetryClient.trackException (at NodeClient.TelemetryClient.trackException (/home/node/node_modules/applicationinsights/out/Library/TelemetryClient.js:75:35): /home/node/node_modules/applicationinsights/out/Library/TelemetryClient.js:75)
   at <no_method> .<no_method> (at /home/node/node_modules/applicationinsights/out/AutoCollection/diagnostic-channel/bunyan.sub.js:24:24:)
   at subscriber (at subscriber (/home/node/node_modules/applicationinsights/out/AutoCollection/diagnostic-channel/bunyan.sub.js:19:13): /home/node/node_modules/applicationinsights/out/AutoCollection/diagnostic-channel/bunyan.sub.js:19)
   at <no_method> .<no_method> (at /home/node/node_modules/diagnostic-channel/dist/src/channel.js:46:25:)
   at ContextPreservingEventEmitter.publish (at ContextPreservingEventEmitter.publish (/home/node/node_modules/diagnostic-channel/dist/src/channel.js:42:23): /home/node/node_modules/diagnostic-channel/dist/src/channel.js:42)
   at Logger.originalBunyan._emit (at Logger.originalBunyan._emit (/home/node/node_modules/diagnostic-channel-publishers/dist/src/bunyan.pub.js:16:42): /home/node/node_modules/diagnostic-channel-publishers/dist/src/bunyan.pub.js:16)
  <followed with some custom libraries>
Same stacktrace is seen in app insights exception table for every exception occurring in my application.
What could be the issue. How to get the actual stack trace of exception in application insights?
Note: My nodejs application is deployed in Azure Kubernetes Service.
' cx='32' cy='32' r='32' /%3E%3Ctext x='50%25' y='55%25' dominant-baseline='middle' text-anchor='middle' fill='%23FFF' %3EAM%3C/text%3E%3C/svg%3E)
@Naveen Kumar Jain S , I wanted to check if you had a chance to review the answer below.
Please 'Accept as answer' if it helped so that it can help others in the community looking for help on similar topics.
Welcome to Microsoft Q&A! Thanks for posting the question.
Based on my understanding, you are using TrackException() from applicationinsights module to log exception to ApplicationInsights in your Node.js appliaction. By default, Node.js SDK for appInsights monitors incoming and outgoing HTTP requests, exceptions, and some system metrics. I tested a simple application and was able to get the exceptions logged to AppInsights.
Regarding the error being received, it looks like the error comes from inside the NodeClient.TelemetryClient.trackException() which might be due to incorrect parameter. Please check if the passed parameter is of type error and is being passed as telemetry.trackException({exception: ex});
Also, framework being used also impacts the behavior of exception. For example the "Express - Node.js web application framework" swallows all the exception and nothing gets written to applicationInsights. Here is the sample application that I tested which works as expected. I did not use any framework for this sample:
const appInsights = require('applicationinsights') //Imported at the beginning of my application
/****************/

const http = require('http');

const hostname = '127.0.0.1';
const port = 3000;


/****************/
appInsights.setup("<<Instrumentation KEY>>")
    .setSendLiveMetrics(true)
    .setAutoCollectRequests(true)
    .setAutoCollectPerformance(true, true)
    .setAutoCollectExceptions(true)
    .setDistributedTracingMode(appInsights.DistributedTracingModes.AI)
    .start()

var telemetry = appInsights.defaultClient;
/****************/

const server = http.createServer((req, res) => {
    try {
        throw new Error('Exception message');
    }
    catch (ex) {
        console.log(ex);
        telemetry.trackException({exception: ex});   //Exception being tracked

    }

    res.statusCode = 200;
    res.setHeader('Content-Type', 'text/plain');
    res.end('Hello World');
});

server.listen(port, hostname, () => {
    console.log(`Server running at http://${hostname}:${port}/`);
});
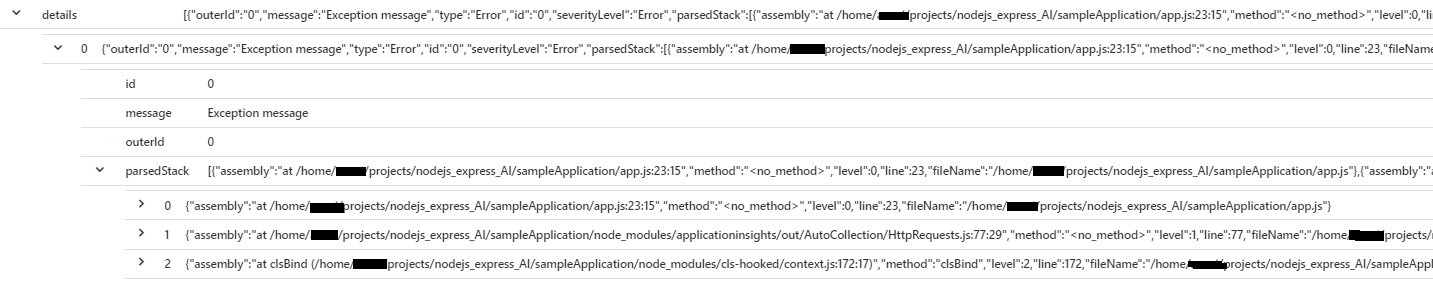
The exception that was recorded contained the stack trace as below:
Can you please review the sample above and see if you are calling trackException() with required parameter? In case this does not help, please share the complete error (along with the message) AND code snippet to better understand it.
Please let me know if you have any questions.
---
Please 'Accept as answer' and ‘Upvote’ if it helped so that it can help others in the community looking for help on similar topics.
@Naveen Kumar Jain S , I wanted to check if you had a chance to review my answer above. Please let me know if you have any queries or concerns.
Please 'Accept as answer' if it helped so that it can help others in the community looking for help on similar topics.
Hi AnuragSingh, Thank you for replying on my question and check on the status. I will be soon checking the solution you provided and reverting to you back. Sorry for not replying in time.
@Naveen Kumar Jain S , thank you for the response. Looking forward to your update.