As you both suggested the Debugger showing wrong information,
i check i release mode, it shows the correct values.
Your description seems to be the opposite of what you were told.
When checking sizes, contents, etc. of variables and constants,
or following execution paths, you need to use a Debug build.
If using a Release build, addresses, contents and even the
actual existence of object code may not match the source code.
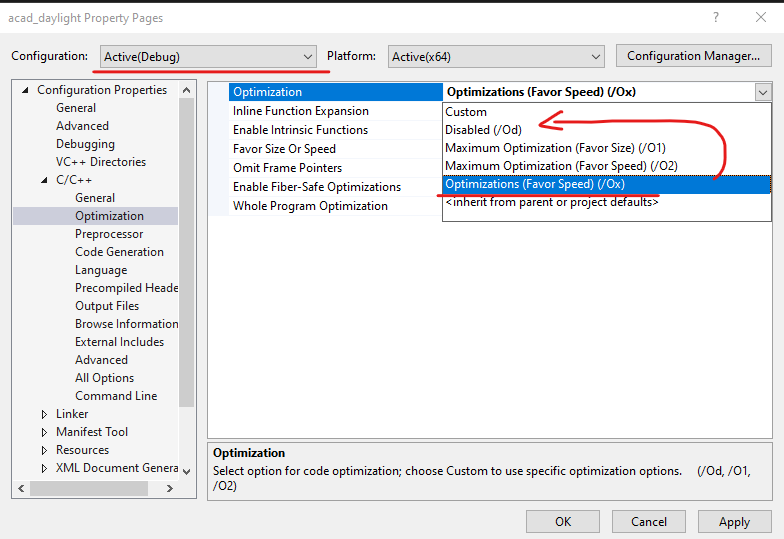
This usually happens because in a Release build optimizations
are enabled by default. You can usually step through code and
watch memory contents in a Release build IF you turn off all
optimizations in the project properties.
In a Debug build, optimizing is off by default so tracing
code execution paths, memory contents, etc. should always
work accurately.
In short, a vector size and contents may not appear as
expected when trying to debug a RELEASE build with
optimizing enabled. But there should be no issues when
checking a vector during debugging of a DEBUG build.
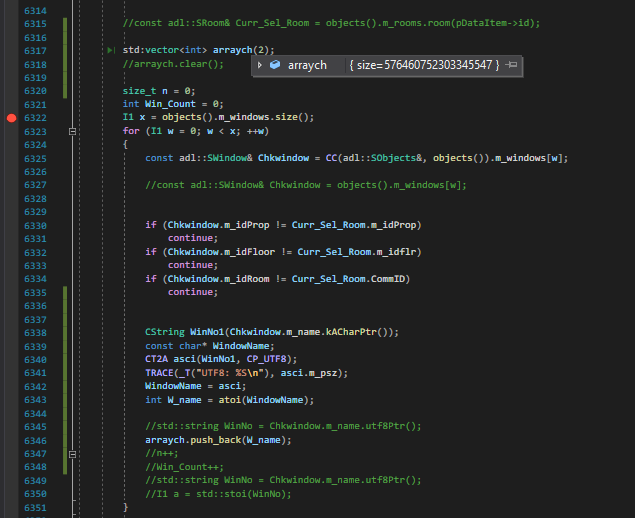
Just wants to know how to rectify the debugger to show the
correct information while debugging..
it is automatically taking the size as some thing else,
see the below
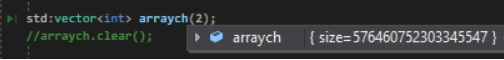
One issue that can affect the debugger's display of the
vector even in a Debug build is trying to examine the
vector before it has actually been constructed.
This appears to be what you have done in the last image
you posted. The caret at the left of the code lines in
the IDE debugger window indicates that you have stopped
ON THE LINE where the vector is declared.
That line will not have been executed yet, so trying to
examine the vector at that point will often show garbage.
You MUST step over (execute) the line declaring the vector
before trying to examine it in the debugger.
' cx='32' cy='32' r='32' /%3E%3Ctext x='50%25' y='55%25' dominant-baseline='middle' text-anchor='middle' fill='%23FFF' %3EWR%3C/text%3E%3C/svg%3E)

' cx='32' cy='32' r='32' /%3E%3Ctext x='50%25' y='55%25' dominant-baseline='middle' text-anchor='middle' fill='%23FFF' %3EDL%3C/text%3E%3C/svg%3E)