Power map to have text on my chart in the map

Jonathan Brotto 1,076 Reputation points
2022-02-08T15:38:25.607+00:00

Is it possible for my charts on my map to show the value of my graphs.

Windows for home | Windows 11 | Apps
Microsoft 365 and Office | Excel | For business | Windows
0 comments No comments
{count} votes

Answer accepted by question author
  1. Ceasar Chen_MSFT 4,486 Reputation points
    2022-02-09T06:15:08.307+00:00

    Hi,@Jonathan Brotto
    From the description of your question, are you trying to make a map and have the data in the chart displayed on the map?
    I made an example, the screenshot is as follows:
    172419-image.png
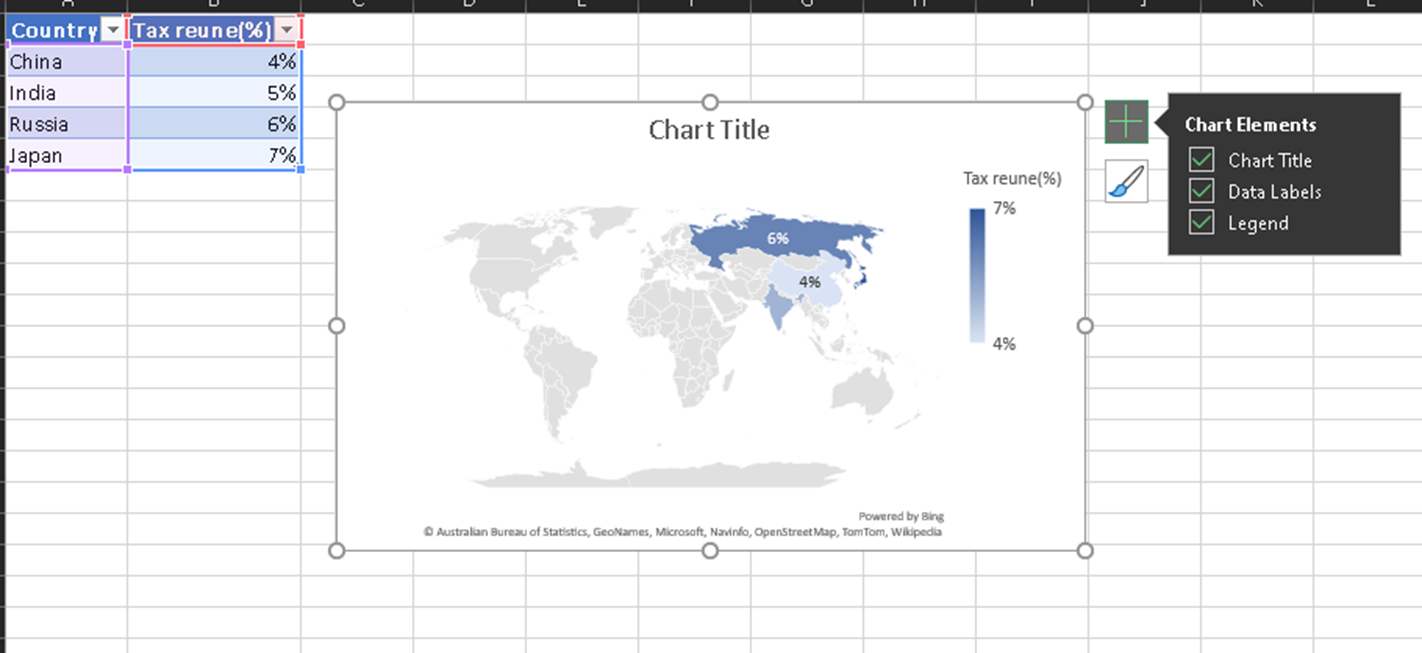
    Click on the chart to check Data Labels to display the data on the map.
    You can refer to this link on how to make a map chart:Create a Map chart in Excel
    If this is not the case, please post your screenshot and explain the problem in detail.


    If the response is helpful, please click "Accept Answer" and upvote it.
    Note: Please follow the steps in our documentation to enable e-mail notifications if you want to receive the related email notification for this thread.

    0 comments No comments

1 additional answer

Sort by: Most helpful
  1. IoTGirl 3,841 Reputation points Microsoft Employee Moderator
    2022-02-08T19:54:45.483+00:00

    I assume you are asking about https://support.microsoft.com/en-us/office/create-a-map-chart-in-excel-f2cfed55-d622-42cd-8ec9-ec8a358b593b? There really isn't enough detail here to help you but maybe you want to look at Power BI maps to get more features? https://learn.microsoft.com/en-us/power-bi/visuals/power-bi-map-tips-and-tricks

    0 comments No comments

Your answer

Answers can be marked as 'Accepted' by the question author and 'Recommended' by moderators, which helps users know the answer solved the author's problem.