' cx='32' cy='32' r='32' /%3E%3Ctext x='50%25' y='55%25' dominant-baseline='middle' text-anchor='middle' fill='%23FFF' %3EY%3C/text%3E%3C/svg%3E)
' cx='32' cy='32' r='32' /%3E%3Ctext x='50%25' y='55%25' dominant-baseline='middle' text-anchor='middle' fill='%23FFF' %3EMT%3C/text%3E%3C/svg%3E)
It partially depends on what version of windbg you're running. With the newer Windbg Preview you click the File ribbon tab and then Start Debugging. On the right side is the list of debugging options and one of them is Open dump file which is the option you want.
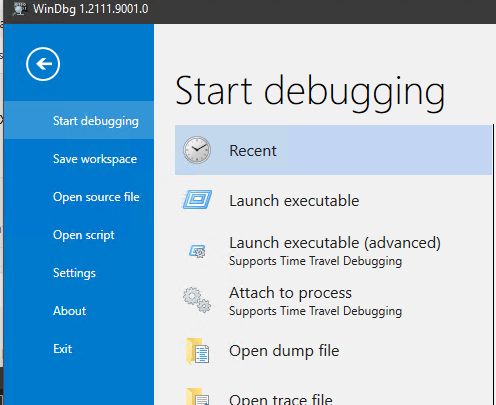
If you're using the original Windbg then use the File \ Open Crash Dump menu item instead. Refer to the following starter documentation on the things you'll need to set up and how to start diagnosing issues.
' cx='32' cy='32' r='32' /%3E%3Ctext x='50%25' y='55%25' dominant-baseline='middle' text-anchor='middle' fill='%23FFF' %3EMP%3C/text%3E%3C/svg%3E)
' cx='32' cy='32' r='32' /%3E%3Ctext x='50%25' y='55%25' dominant-baseline='middle' text-anchor='middle' fill='%23FFF' %3ED%3C/text%3E%3C/svg%3E)