Hi @BeUnique ,
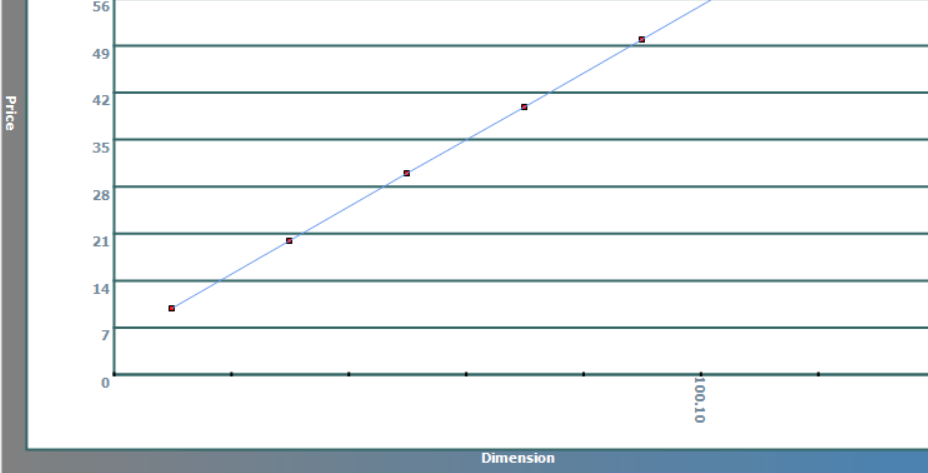
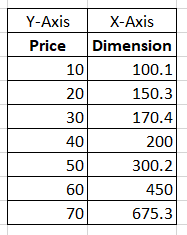
Maybe you can try WebControl's free chart control for ASP.NET.
First, you need to download the WebControl.dll file (the dll file cannot be uploaded, it is recommended to download it from Google)
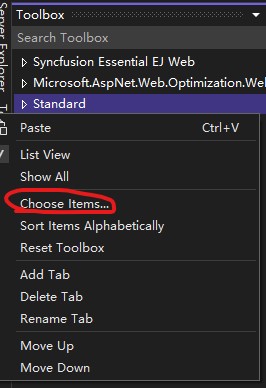
Then add the WebChart control to the toolbox and select the options menu "View -> Toolbox".
Right click on it and select the option Customize Toolbox.
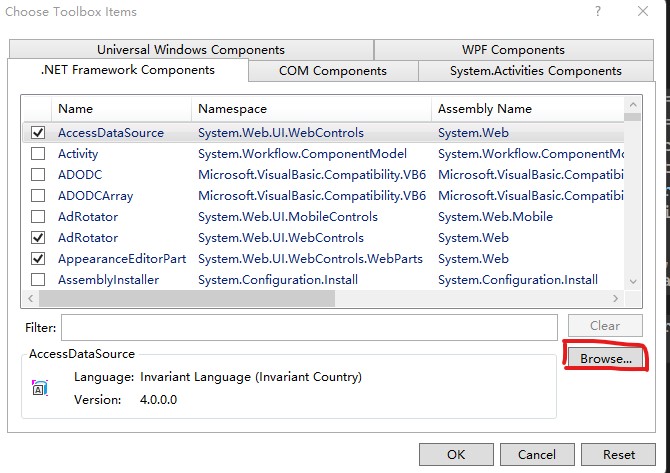
Once in the Customize Toolbox dialog, select the .NET Framework Components tab. Click the Browse button.
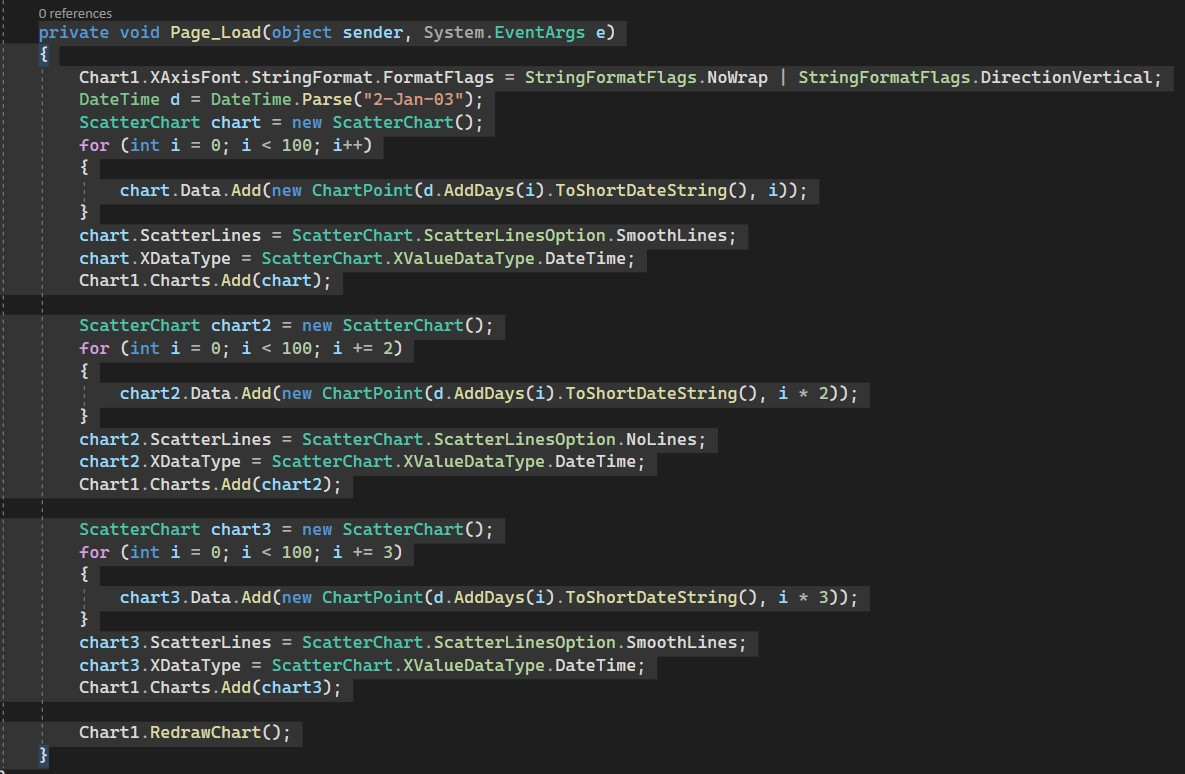
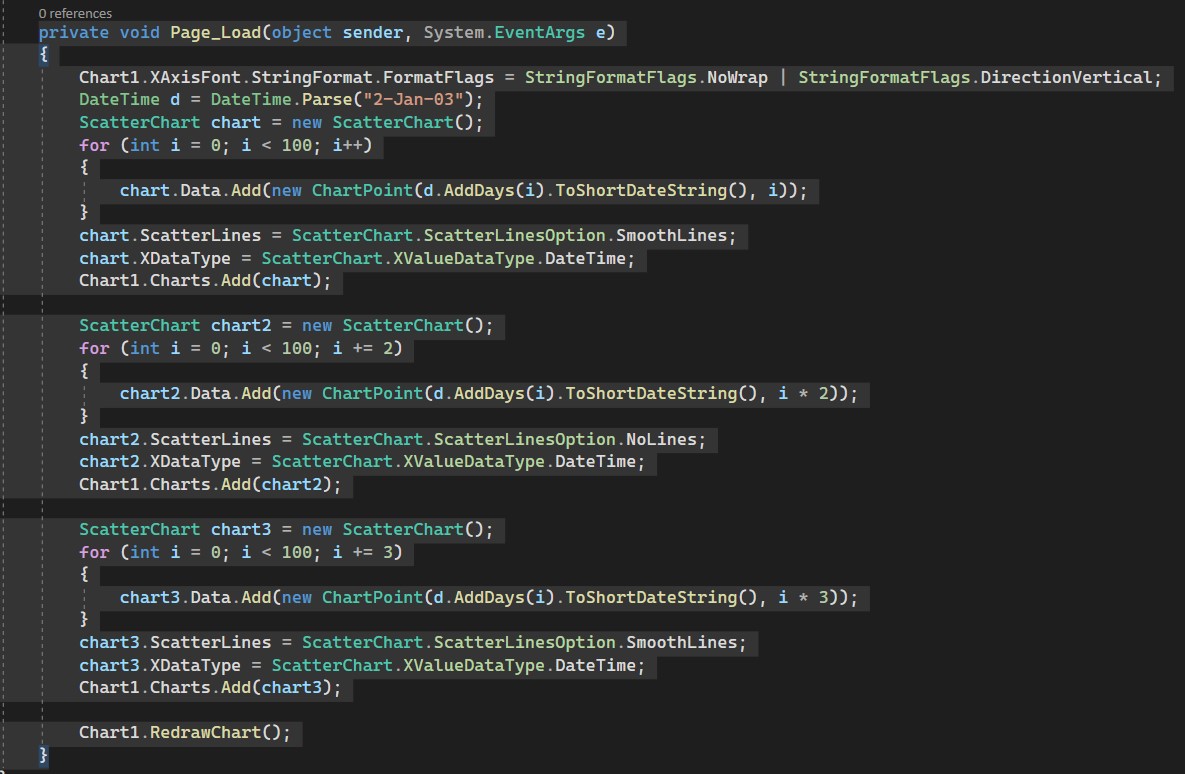
Then just drag a chart control, you can refer to the example below
<Web:ChartControl id="Chart1" runat="server" BorderWidth="5px" BorderStyle="Outset" HasChartLegend="False" Padding="20"  ChartPadding="60" TopPadding="15" Height="551px" Width="827px" XValuesInterval="10">
 <YTitle ForeColor="White" StringFormat="Center,Near,Character,DirectionVertical" Text="Units" Font="Tahoma, 8pt, style=Bold"></YTitle>
 <ChartTitle ForeColor="DeepSkyBlue" StringFormat="Near,Near,Character,LineLimit" Text="This is a ScatterChart Test" Font="Verdana, 10pt, style=Bold"></ChartTitle>
 <XTitle ForeColor="White" StringFormat="Center,Near,Character,NoWrap" Text="Date" Font="Tahoma, 8pt, style=Bold"></XTitle>
 <Background Type="LinearGradient" StartPoint="0, 0" ForeColor="SteelBlue" EndPoint="800, 500" Color="Gray" HatchStyle="DiagonalBrick"></Background>
 <Border EndCap="Flat" DashStyle="Solid" StartCap="Flat" Color="51, 102, 102" Width="2" LineJoin="Miter"></Border>
 <PlotBackground Type="Solid" StartPoint="0, 0" ForeColor="White" EndPoint="100, 100" Color="White" HatchStyle="Shingle"></PlotBackground>
 <YAxisFont ForeColor="115, 138, 156" StringFormat="Far,Near,Character,LineLimit" Font="Tahoma, 8pt, style=Bold"></YAxisFont>
 <XAxisFont ForeColor="115, 138, 156" StringFormat="Near,Center,None,DirectionVertical" Font="Tahoma, 8pt, style=Bold"></XAxisFont>
 <Legend Width="100" Font="Tahoma, 8pt">
 <Border EndCap="Flat" DashStyle="Solid" StartCap="Flat" Color="Black" Width="0" LineJoin="Miter"></Border>
 <Background Type="Solid" StartPoint="0, 0" ForeColor="Black" EndPoint="100, 100" Color="White" HatchStyle="Shingle"></Background>
 </Legend>
 </Web:ChartControl>
Best regards,
Lan Huang
If the answer is the right solution, please click "Accept Answer" and kindly upvote it. If you have extra questions about this answer, please click "Comment".
Note: Please follow the steps in our documentation to enable e-mail notifications if you want to receive the related email notification for this thread.
