Hi guys, I need some help with the formula to create a calculated columns in excel.

Anonymous
2022-03-06T16:35:45.77+00:00

180465-pilpeline.pngHi guys, I need some help with the formula to create a calculated columns in excel.
Considering columns A to AC, I need to calculate F to AC columns.

I need to calculate columns with the logic :

IF the Client A has Duration Months contact of 3 months, Forecast Begin Date starts from 01-10-2022 (October 1, 2022) and Potential MRR (monthly contract value) $75

So, if the contract starts from October 1, 2022 for 3 months then the result should show in columns O, P Q and rest for the columns should show as 0.

Similarly, Client B result should show for 3 months in columns H, I and J as $50 (contract starts from 01-03-2022, "March 1, 2022", rest as 0)

Thanks in advance

180397-pipeline.txt

Microsoft 365 and Office | Development | Other
Microsoft 365 and Office | Excel | For business | Windows
0 comments No comments
{count} votes

Accepted answer
  1. Emily Hua-MSFT 27,796 Reputation points
    2022-03-07T03:14:00.937+00:00

    Hi @SumiteshKumar-6515

    Please check whether the following information is helpful.

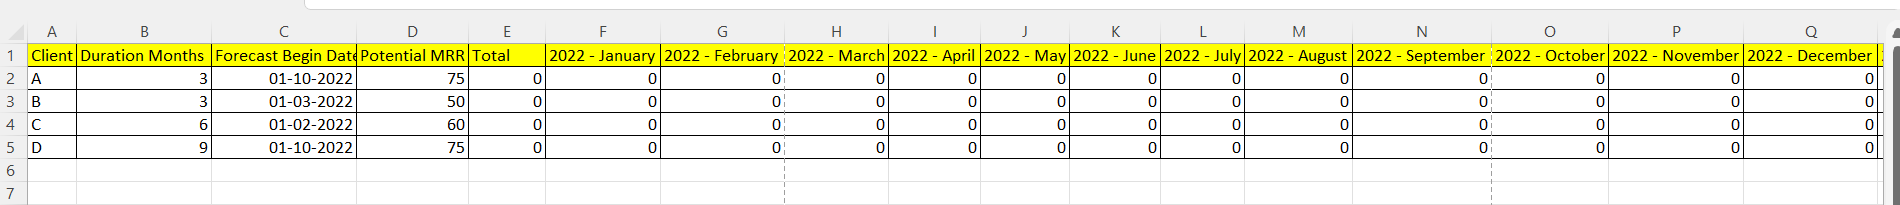
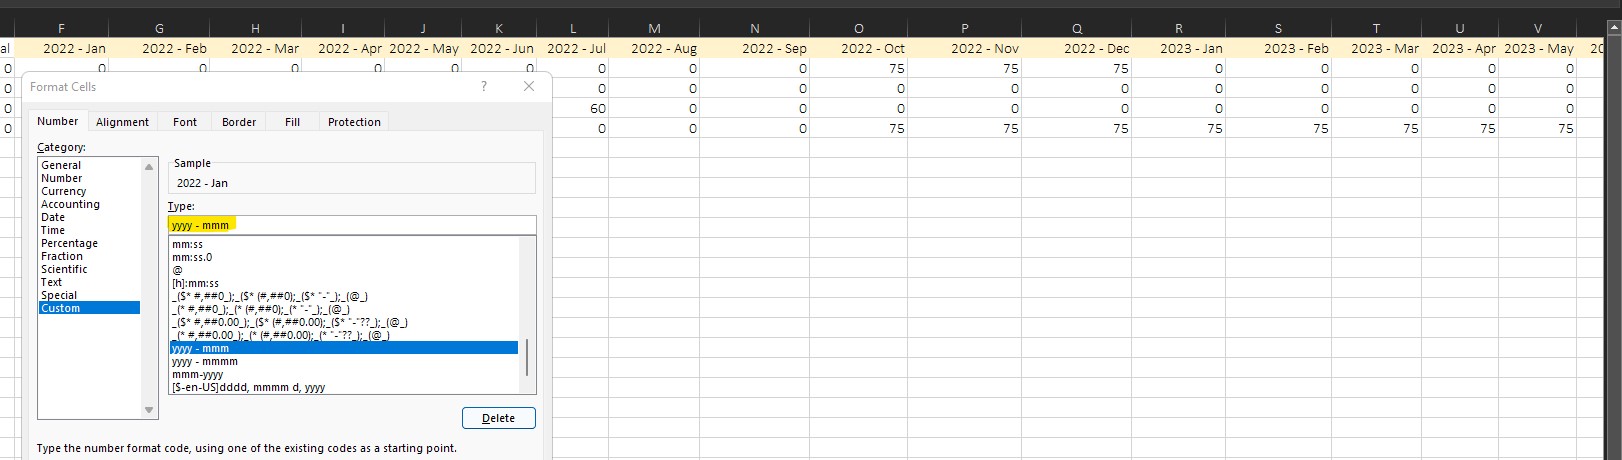
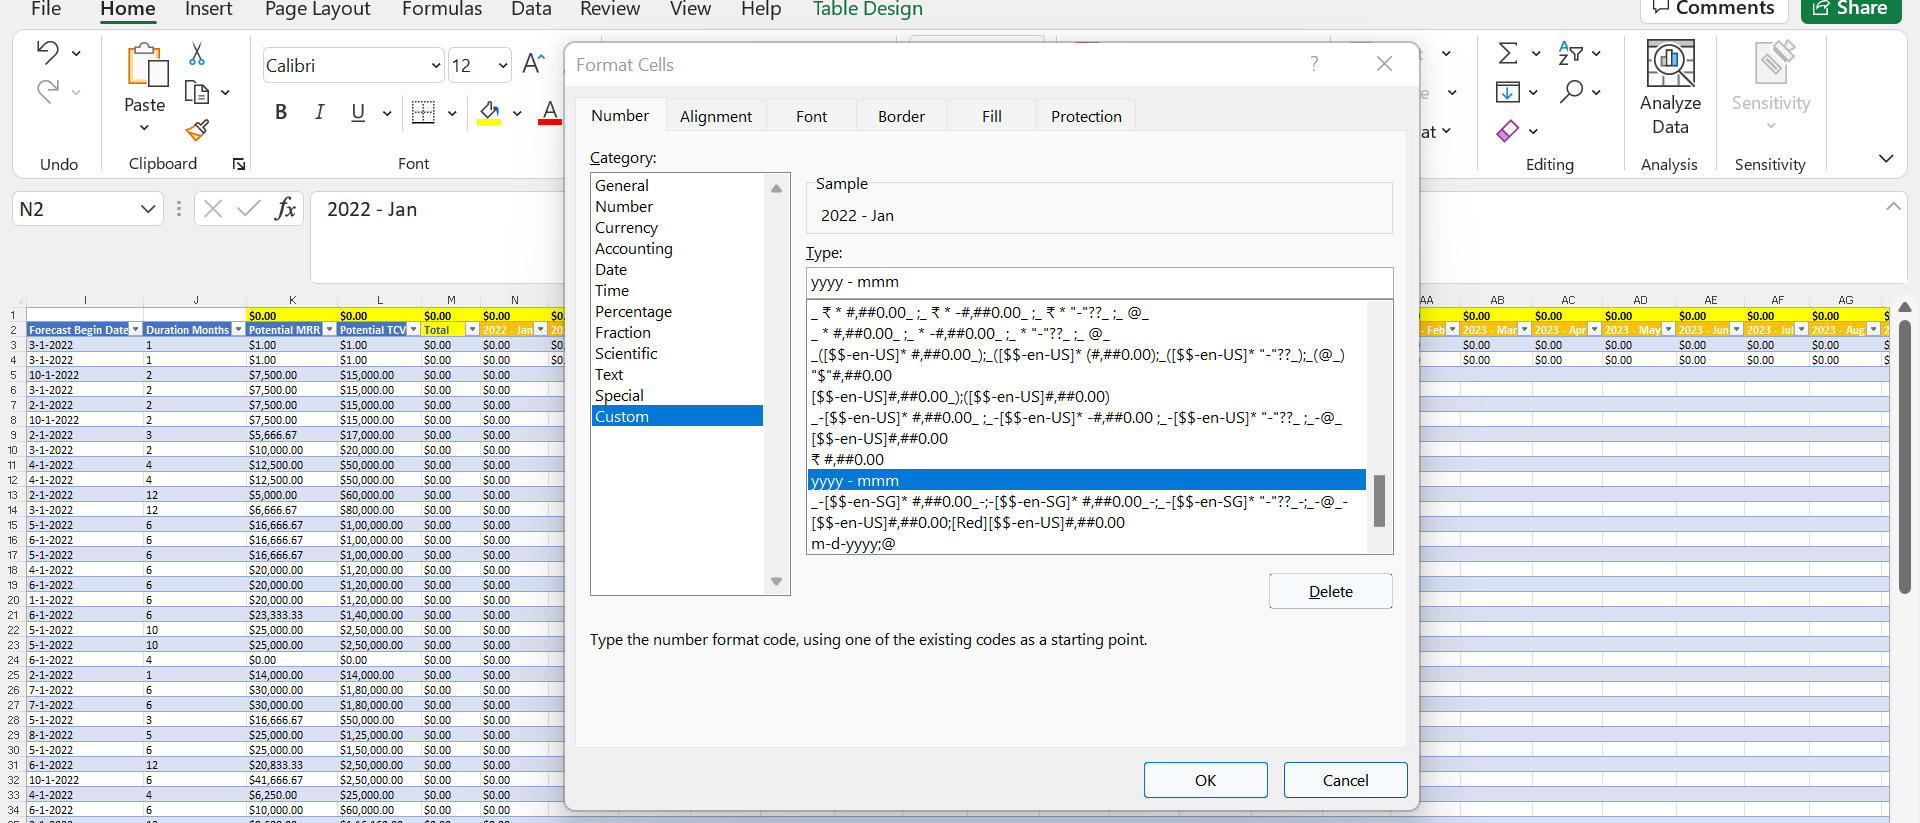
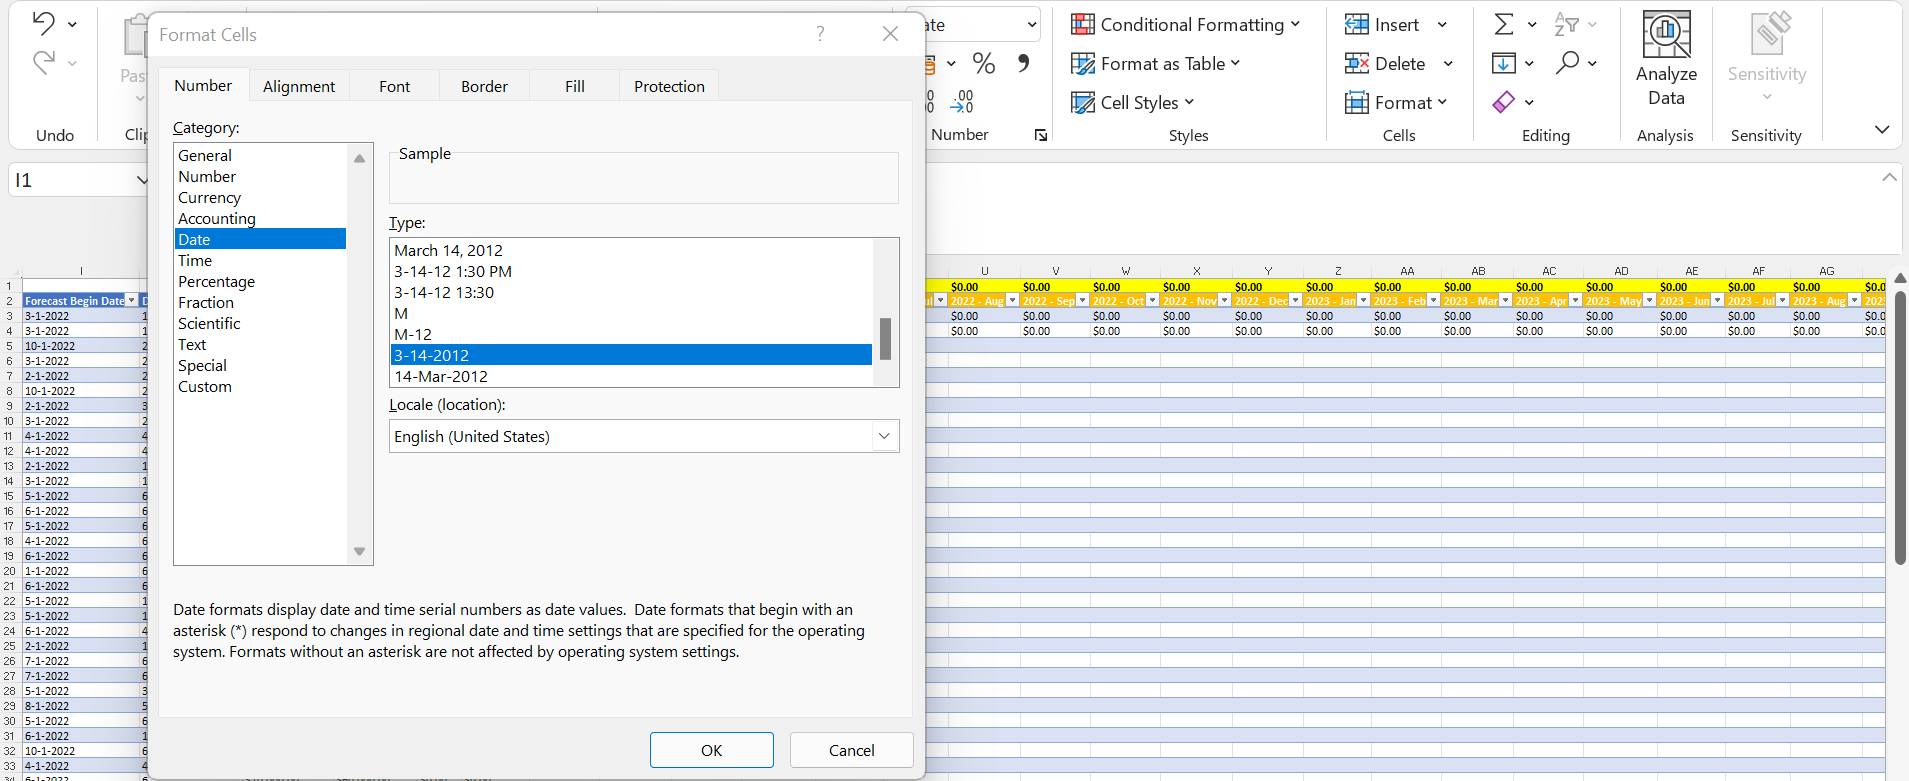
    First, I suggest you custom the cell formart for F1 to AC1, that using yyyy - mmm to show the Year and Month as the image below.
    180418-capture8.jpg

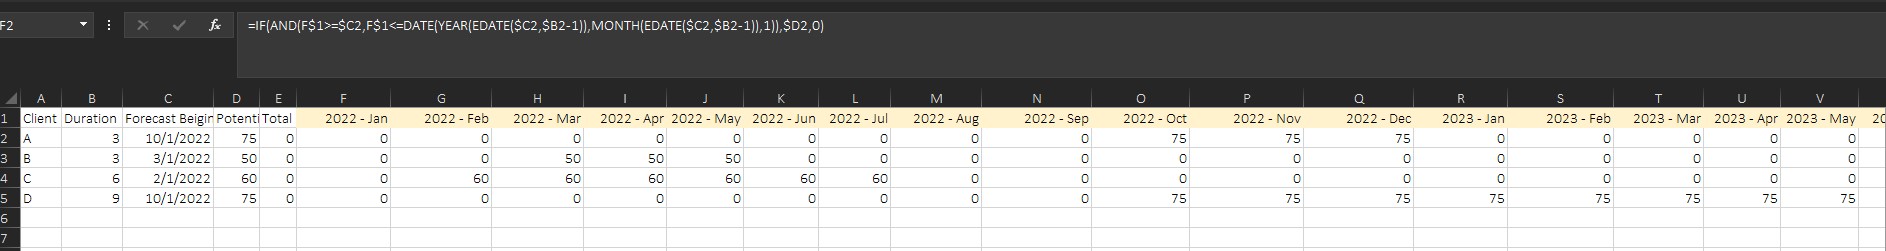
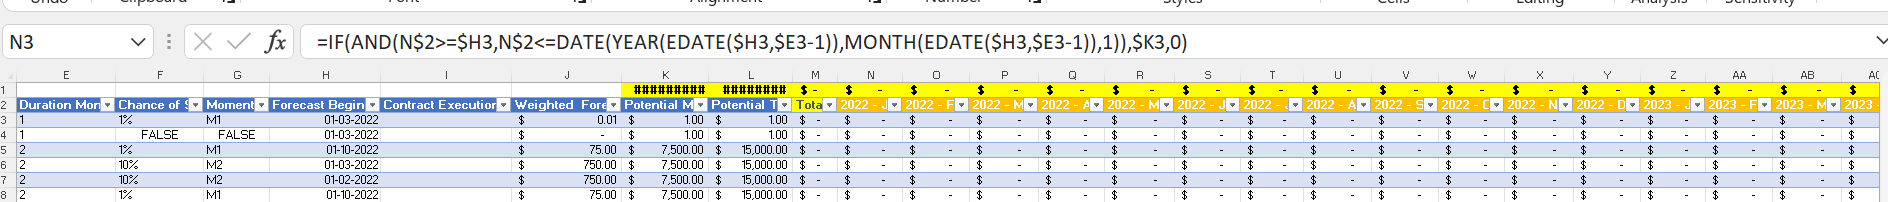
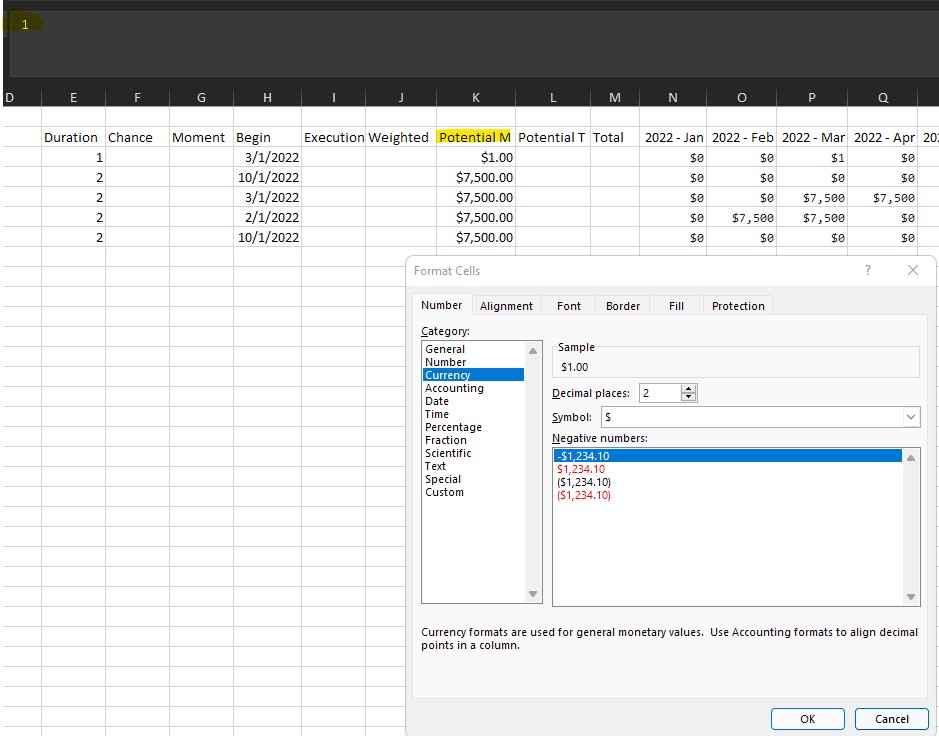
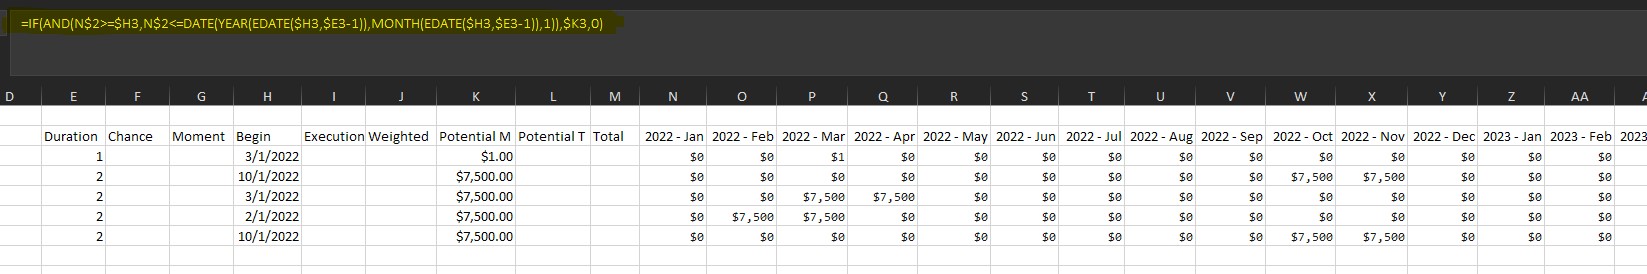
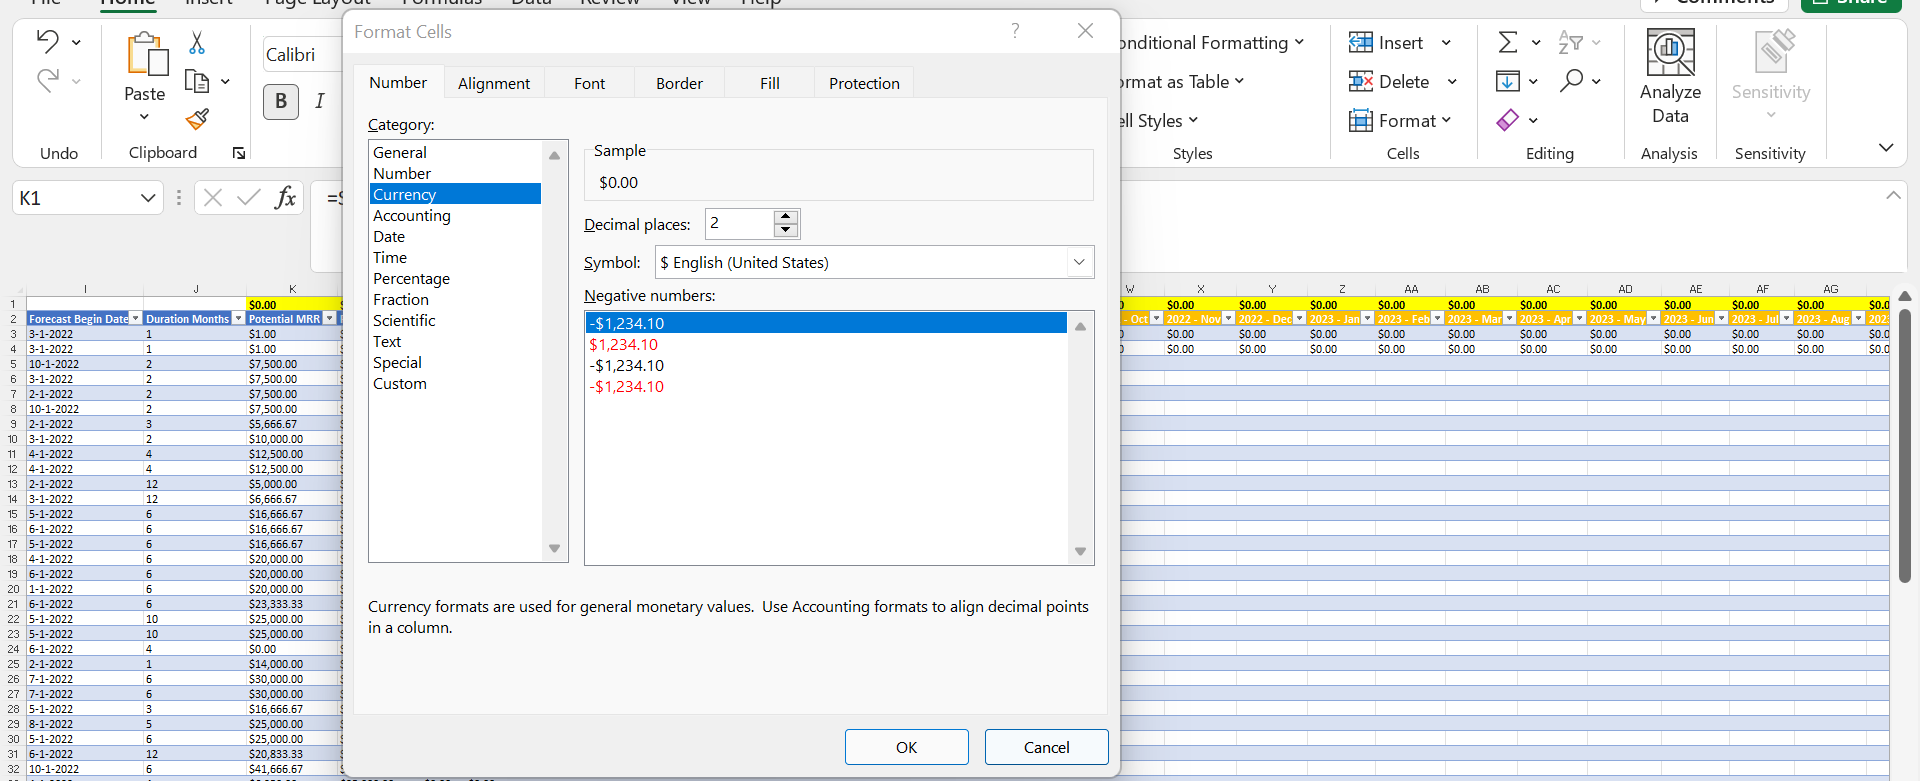
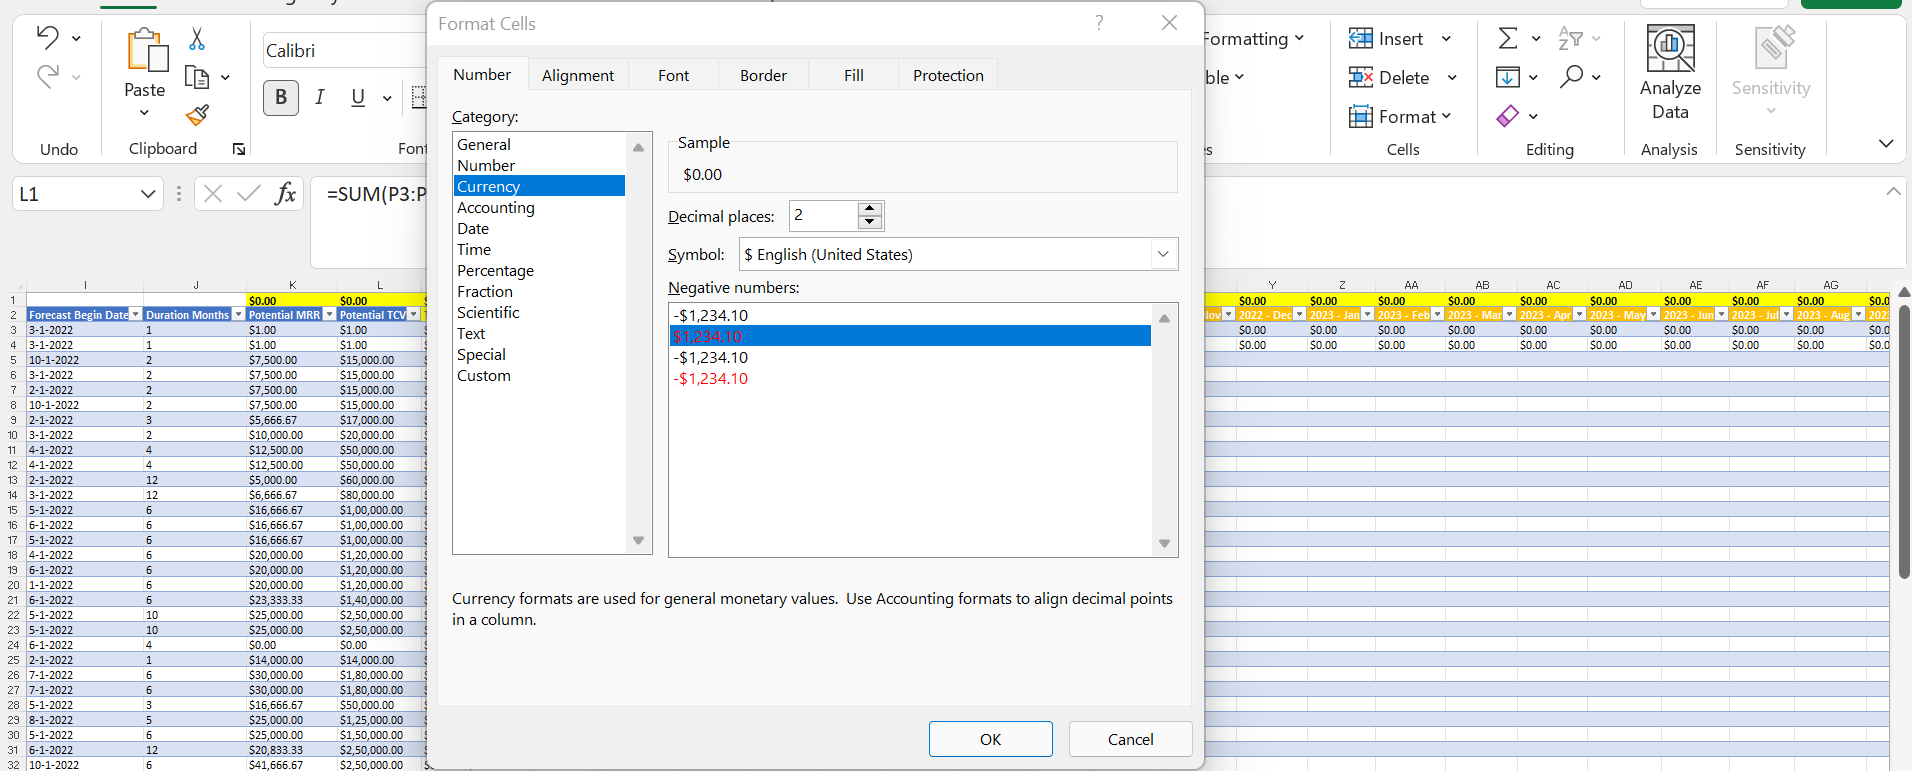
    Then try this formula =IF(AND(F$1>=$C2,F$1<=DATE(YEAR(EDATE($C2,$B2-1)),MONTH(EDATE($C2,$B2-1)),1)),$D2,0) in cell F2, then dag it down and right to fill the Potential MRR or value 0 into cells.
    180477-capture9.jpg

    Any misunderstandings, please let me know.


    If the answer is helpful, please click "Accept Answer" and kindly upvote it. If you have extra questions about this answer, please click "Comment".
    Note: Please follow the steps in our documentation to enable e-mail notifications if you want to receive the related email notification for this thread.


1 additional answer

Sort by: Most helpful
  1. Herbert Seidenberg 1,191 Reputation points
    2022-03-12T18:45:07.567+00:00

    Excel 365 Pro Plus with Power Query and Power Pivot.
    As Emily so rightly shows, it's all about formatting.
    Since PQ tracks, labels, flags and enforces Types of data
    ( numbers, dates, times, text, etc ) very well,
    I suggest trying Power Query.
    No formulas, no VBA macro.
    With PivotChart.
    https://www.mediafire.com/file/wpw0eblyj5ywycg/03_11_22.xlsx/file
    https://www.mediafire.com/file/cpk5xl6c532s38s/03_11_22.pdf/file


Your answer

Answers can be marked as Accepted Answers by the question author, which helps users to know the answer solved the author's problem.