Please enable asynchronous statistics update, and make sure that the configuration to wait at low priority for asynchronous statistics update is disabled. This will avoid some Sch-M locks that auto statistics update can produce and that can impact query performance.
ALTER DATABASE CURRENT SET AUTO_UPDATE_STATISTICS_ASYNC ON;
ALTER DATABASE SCOPED CONFIGURATION SET ASYNC_STATS_UPDATE_WAIT_AT_LOW_PRIORITY = ON;
The following query tells you which resource consumption is creating DTU spike:
SELECT
    (COUNT(end_time) - SUM(CASE WHEN avg_cpu_percent > 80 THEN 1 ELSE 0 END) * 1.0) / COUNT(end_time) AS 'CPU Fit Percent'
    ,(COUNT(end_time) - SUM(CASE WHEN avg_log_write_percent > 80 THEN 1 ELSE 0 END) * 1.0) / COUNT(end_time) AS 'Log Write Fit Percent'
    ,(COUNT(end_time) - SUM(CASE WHEN avg_data_io_percent > 80 THEN 1 ELSE 0 END) * 1.0) / COUNT(end_time) AS 'Physical Data Read Fit Percent'
FROM sys.dm_db_resource_stats
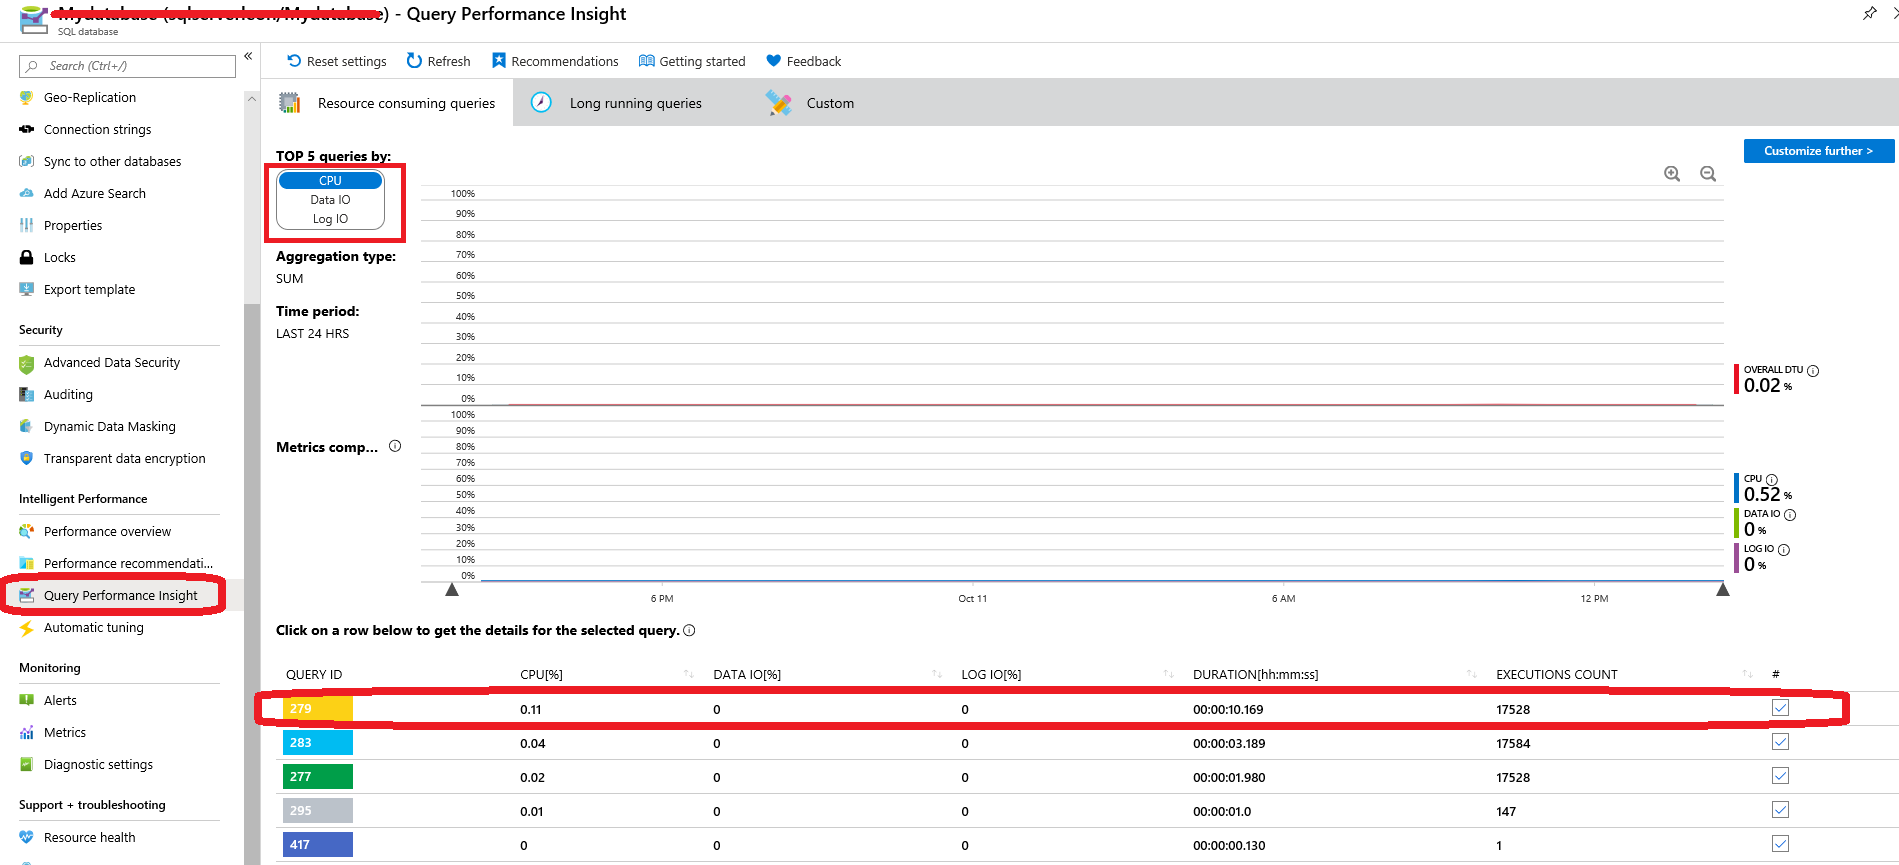
Once you determine which resource is creating the spike go to Query Performance Insight and see top queries affecting that resource:

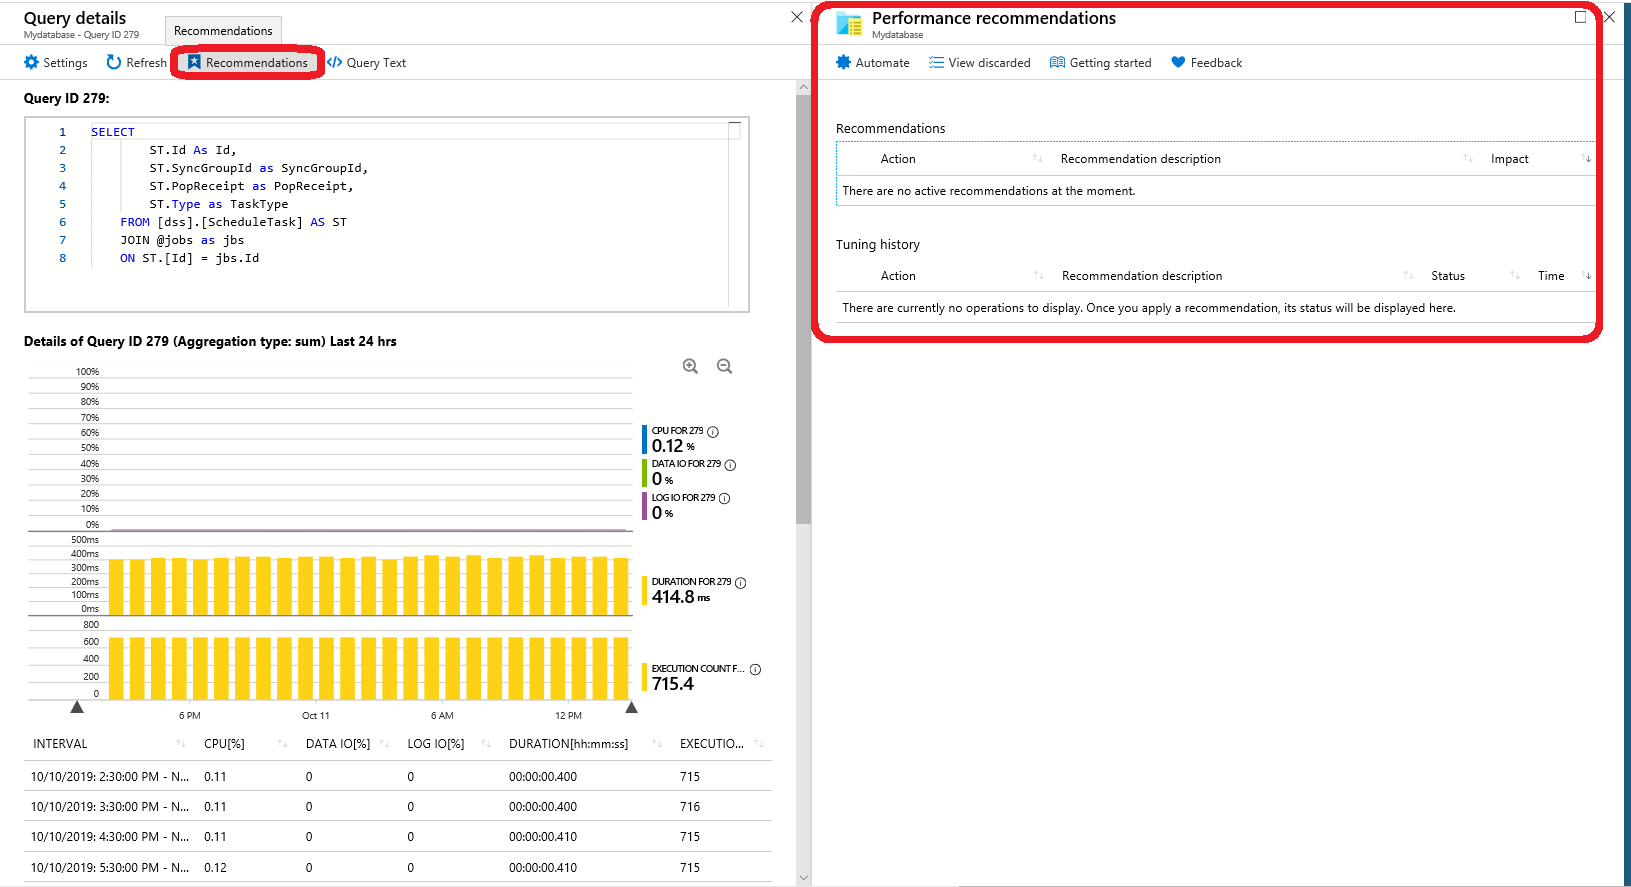
Click on any query which shows high resource usage. It will show you the query statements and give you the performance recommendations. Examine the query plan of the query and see operators showing high costs.

Please make sure you update statistics daily. You can use Ola scripts to speed up the process.
EXECUTE dbo.IndexOptimize
@Databases = 'YourDBName',
@FragmentationLow = NULL,
@FragmentationMedium = NULL,
@FragmentationHigh = NULL,
@UpdateStatistics = 'ALL',
@OnlyModifiedStatistics = 'Y'

