Azure Monitor
An Azure service that is used to collect, analyze, and act on telemetry data from Azure and on-premises environments.
3,037 questions
This browser is no longer supported.
Upgrade to Microsoft Edge to take advantage of the latest features, security updates, and technical support.
' cx='32' cy='32' r='32' /%3E%3Ctext x='50%25' y='55%25' dominant-baseline='middle' text-anchor='middle' fill='%23FFF' %3EHQ%3C/text%3E%3C/svg%3E)
I would like to pin information to Dashboard.
In Azure monitor, in the 'Container' blade (under 'insights'), the 'pin to a dashboard' button is missing.
Is there a queries/workbooks behind that can be used to get the same summary?
How can I report this missing button to Azure, the other blades have the 'pin to dashboard' button?

This would probably be a custom workbook that queries the resource graph. Look in the Resource Graph Explorer under resources>microsoft.containerinstance/containergroups
resources
| where type == "microsoft.containerinstance/containergroups"
Thank you for the reply, I also think there is a custom query behind with a visualization. My question is, is it possible to find it and re-use it instead of remaking it?
The blade shows directly the status (healthy, warning, etc.) of all the clusters, nodes, pods, which is very nice.
That is a common ask though I am not aware of a way to see the underlying queries. You might look through the workbook templates. There may be something similar there.
' cx='32' cy='32' r='32' /%3E%3Ctext x='50%25' y='55%25' dominant-baseline='middle' text-anchor='middle' fill='%23FFF' %3ESM%3C/text%3E%3C/svg%3E)
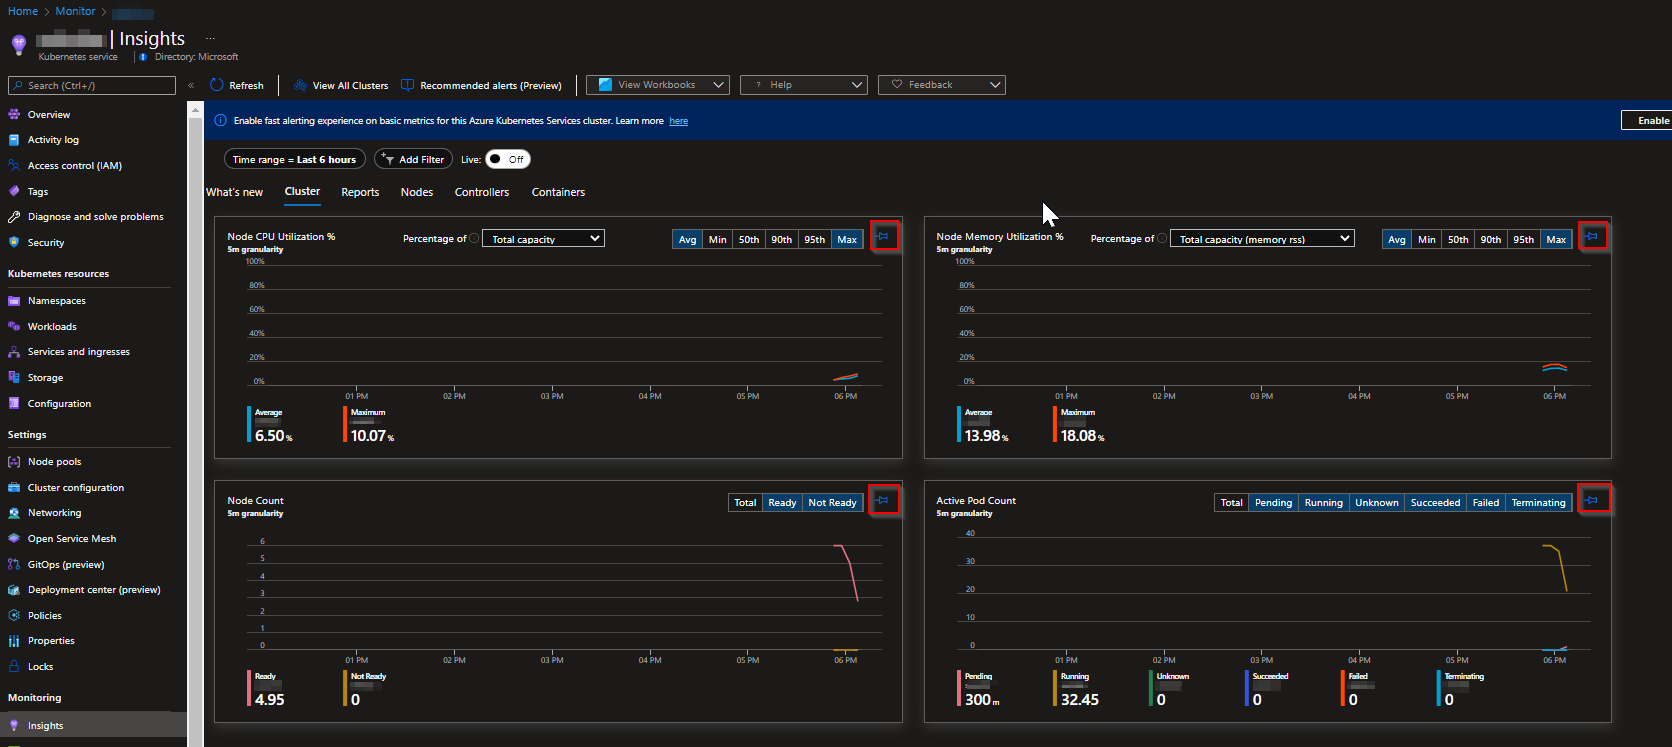
@Huu Quang Nguyen Welcome to Microsoft Q & A Community Forum. I understand that you are trying to pin the charts that were displayed in the Insights tab of the Kubernetes resource. I have verified from my end, and I could see that the pin option is available. Sharing the reference of the same. Do comment if you are not able to see the pin icon in Azure portal.
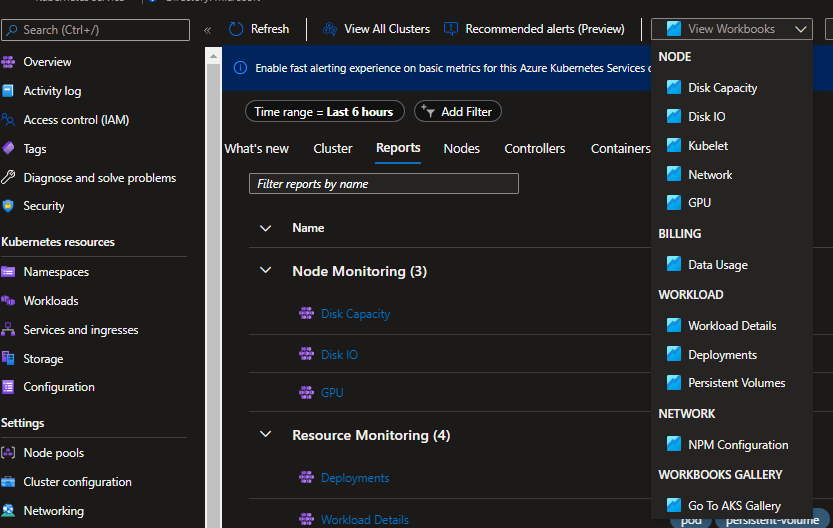
For the queries used for visualization, you can check the built-in workbooks as mentioned by Andrew by selecting the drop-down menu of "View Workbooks" as shown in below image.
If in case, you would like to customize the queries, you can update container insights to update the metrics and write those metrics to Azure Monitor metrics store to query the data. With this, you can present timely aggregate calculations (average, count, maximum, minimum, sum) in performance charts, pin performance charts in Azure portal dashboards, and take advantage of metric alerts. For more information, kindly check this document.