Community Center | Not monitored
Tag not monitored by Microsoft.
This browser is no longer supported.
Upgrade to Microsoft Edge to take advantage of the latest features, security updates, and technical support.
' cx='32' cy='32' r='32' /%3E%3Ctext x='50%25' y='55%25' dominant-baseline='middle' text-anchor='middle' fill='%23FFF' %3EC%3C/text%3E%3C/svg%3E)
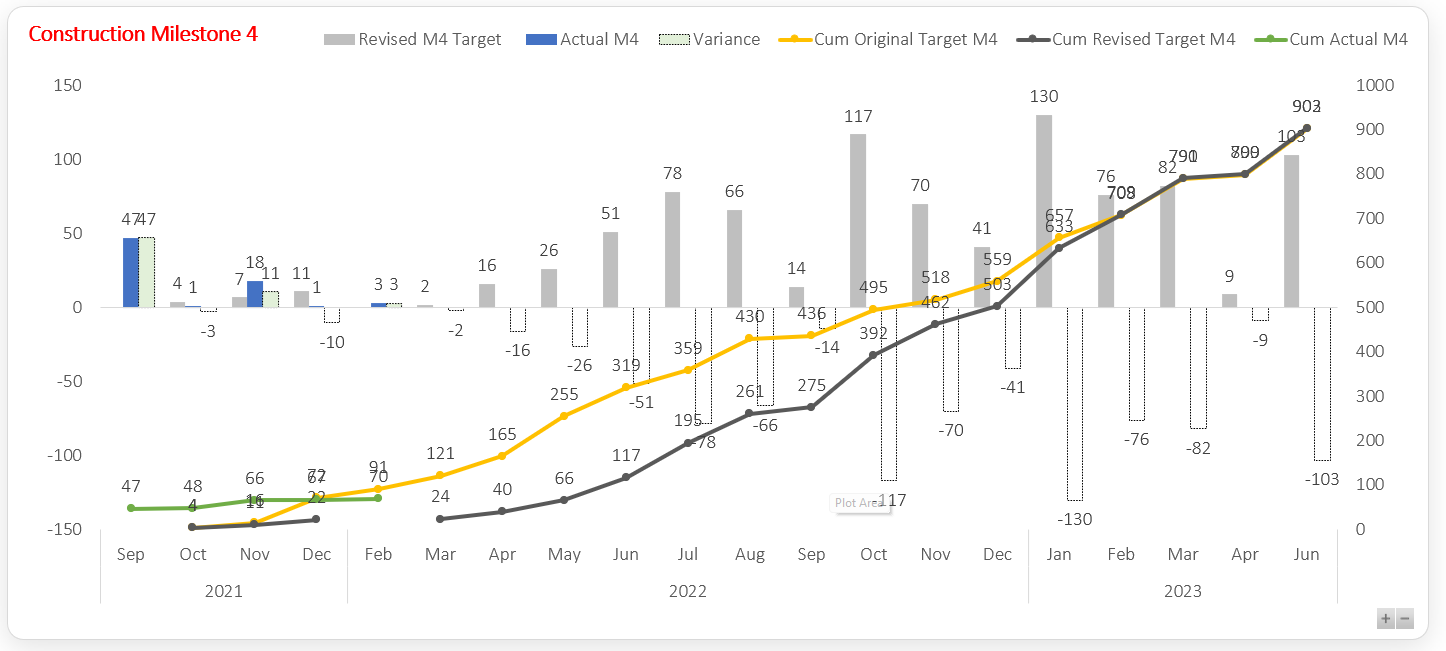
Hi, Microsoft. Need help in figuring this out. The above screenshot is the graph I made using PowerPivot and DAX formula. For reference, here's the formula:
=CALCULATE(COUNTA(Actual[Actual - M4]),FILTER(ALLSELECTED(DataDateM4[Date]),ISONORAFTER(DataDateM4[Date],MAXA(Actual[Actual - M4]),desc)))
here's the Pivot Table as well:
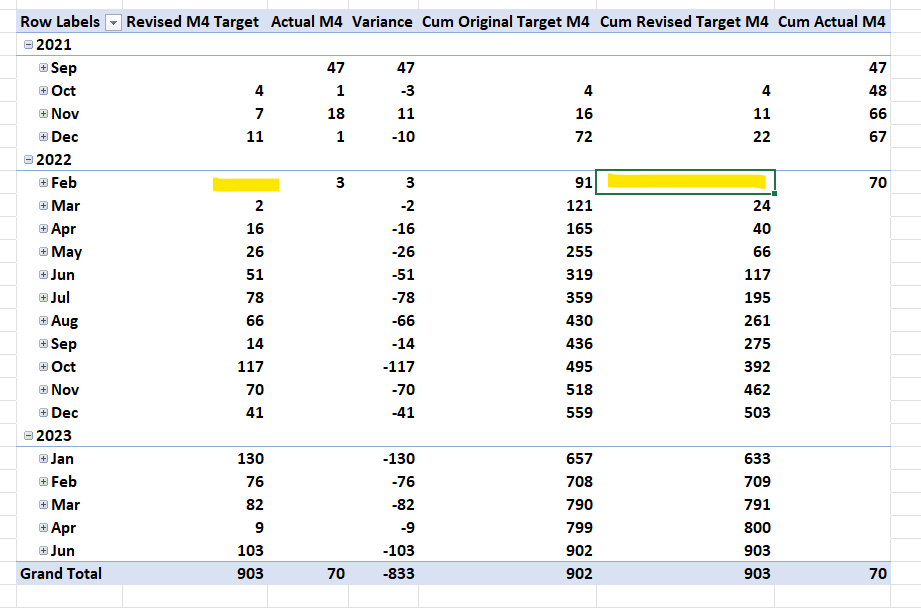
The yellow ones are what cause the breakage in the graph. Can you help me figure out the right DAX formula? Thank you