Azure Functions
An Azure service that provides an event-driven serverless compute platform.
4,678 questions
This browser is no longer supported.
Upgrade to Microsoft Edge to take advantage of the latest features, security updates, and technical support.
' cx='32' cy='32' r='32' /%3E%3Ctext x='50%25' y='55%25' dominant-baseline='middle' text-anchor='middle' fill='%23FFF' %3EJP%3C/text%3E%3C/svg%3E)
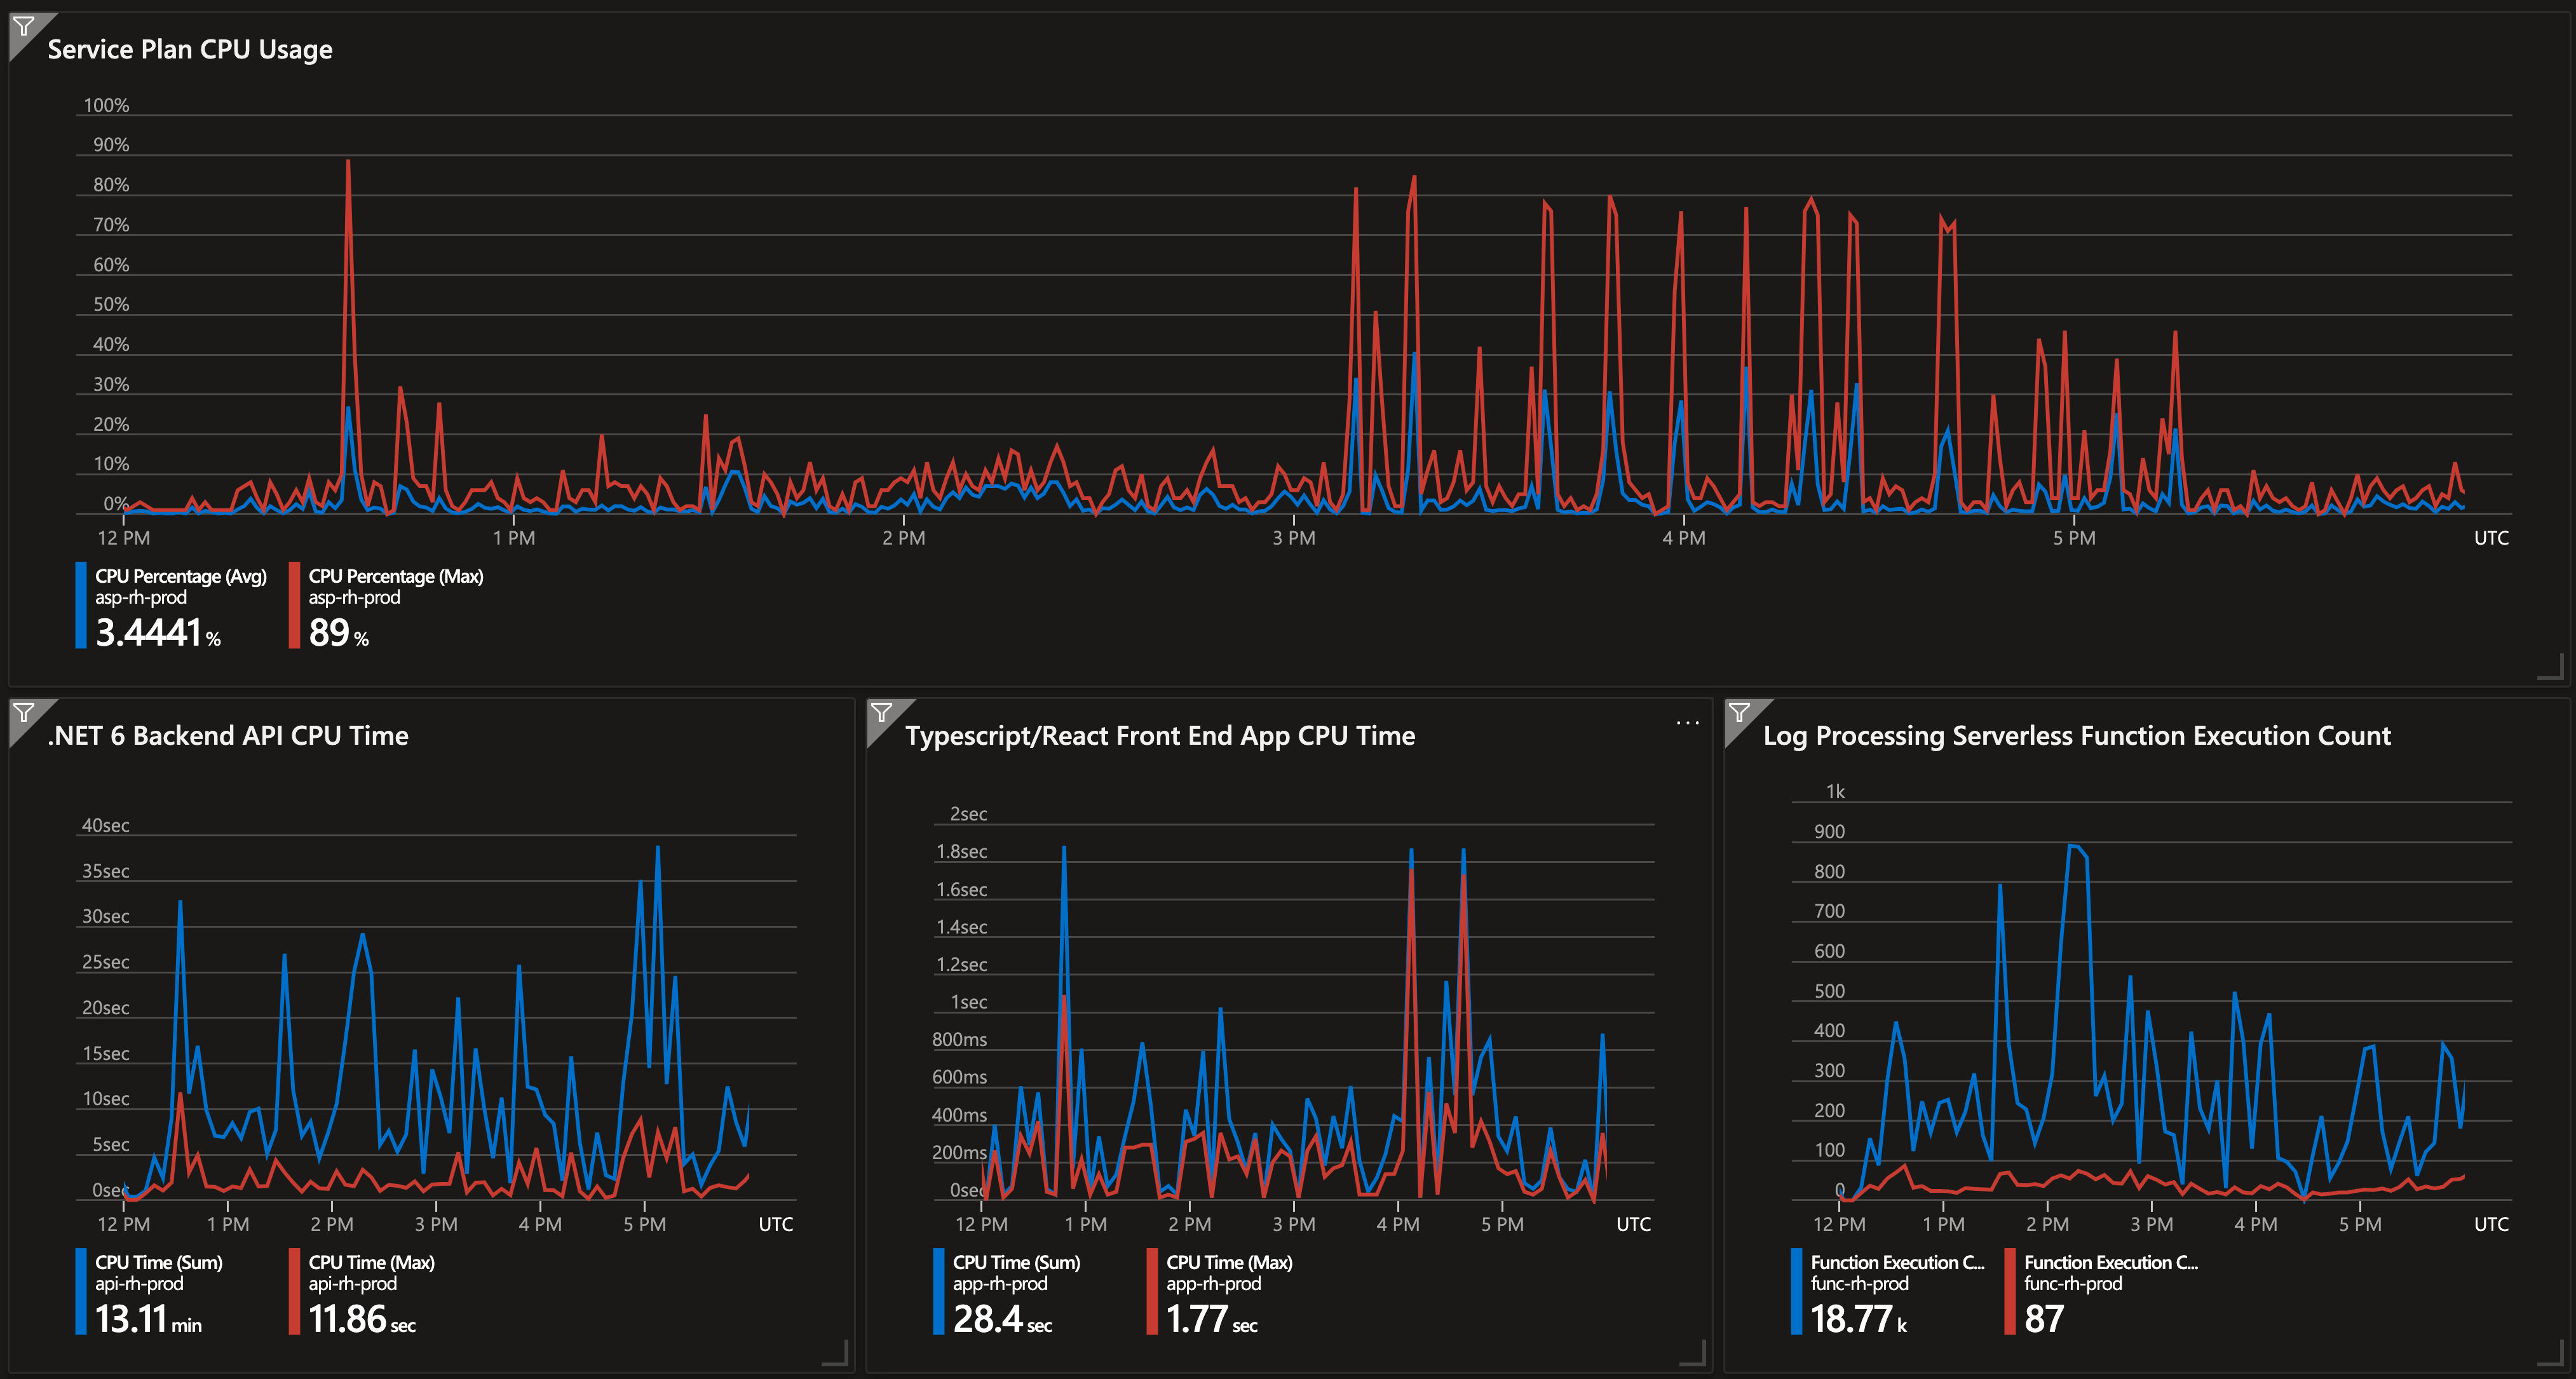
I have a P2V2 Azure Service Plan with 2 web app resources (a .NET 6 backend API and a React/Typescript front end) and 1 serverless function resource (single function that processes logs from the API to send to Datadog). I have been monitoring the CPU usage on the ASP and we regularly see spikes into 70%-80% range, and even weekly into the 90's. This is not sustained, just spikes then it comes back down. Overall, the average CPU usage is very low, but I am trying to determine what is causing the spikes. In the Dashboard screenshot below you can see the ASP CPU usage (top graph), our API (bottom left) and web app (bottom middle) CPU times, as well as our serverless function (bottom right) execution count (for lack of a better comparison metric). Based on the bottom graphs, it is clear the API is using more CPU than the web app, though other than the very first ASP CPU spike it does not seem any of the spikes correspond to any spikes in the bottom graphs.
I have tried to identify CPU usage issues using the diagnostic tools. The ASP doesn't really have any specific reporting for CPU under "Diagnose and solve problems". But I did use the "Availability and Performance" tool under our .NET API app. The overview of this always says that CPU is fine. I have enabled the High CPU Analysis to collect data dumps if the average CPU usage is over 50% (that's that lowest limit). However, the average CPU usage is always very low, it's only max CPU usage that spikes.
I have also tried to profile the backend API web app using Kudu/Process Explorer. However the .diagsession file fails to open in Visual Studio Pro 2022 with the message "Failed to analyze data". I have been unable to find much documentation on doing this profiling through the Kudu interface to determine why these profiling sessions can't be opened.
We are currently running on a larger ASP instance than is likely necessary to accommodate these spikes. Is there a better way to investigate what is causing these spikes?
' cx='32' cy='32' r='32' /%3E%3Ctext x='50%25' y='55%25' dominant-baseline='middle' text-anchor='middle' fill='%23FFF' %3EA%3C/text%3E%3C/svg%3E)
JoshPharis-1233, Thanks for the detailed description of the issue. Apologies you’re seeing this issue.
As I understand you have explored all the CPU related diagnostics from Azure Portal diagnostic blade. And, you're leveraging large instance size VM to accommodate high traffic.
Just to clarify, do you also have a Web Job running? I have seen a few cases where high CPU usage was due to specific method/call in the application or/ webjob.
To better assist you on this, we would need your Azure WebApp and subscription details ( which are PII), so I’ll follow-up with you privately.
--In regard to, performing the profiling in VS, typically you should be able to investigate -It may be a local/temp issue, try updating VS and open VS in elevated mode (Run as administrator), and then test to see if it helps. See this similar discussion on Dev community forum (dedicated forum for VS support).
Measure application performance from the command line
To analyze .diagsession you may also leverage PerfView (https://github.com/microsoft/perfview) || PerfView-tutorial
PerfView is a free performance-analysis tool that helps isolate CPU and memory-related performance issues.
It is a Windows tool, but it also has some support for analyzing data collected on Linux machines.
' cx='32' cy='32' r='32' /%3E%3Ctext x='50%25' y='55%25' dominant-baseline='middle' text-anchor='middle' fill='%23FFF' %3EAS%3C/text%3E%3C/svg%3E)
You can use benchmark.net to profile your specific methods in your code
To get to which method that would be, you need a profiler that can profile both cpu and memory congestion, a lot them actually are there to try