Community Center | Not monitored
Tag not monitored by Microsoft.
This browser is no longer supported.
Upgrade to Microsoft Edge to take advantage of the latest features, security updates, and technical support.
' cx='32' cy='32' r='32' /%3E%3Ctext x='50%25' y='55%25' dominant-baseline='middle' text-anchor='middle' fill='%23FFF' %3EA%3C/text%3E%3C/svg%3E)
Hello, I have a Power BI problem however I have no reasonable knowledge of the tool and was kind of forced to use it as my csv data file was too large for Excel so I'm hoping for some guidance from the community.
I have the data and a simple view already and now require an alternate view.
The CSV file has the following columns:
Timestamp | Path | Size
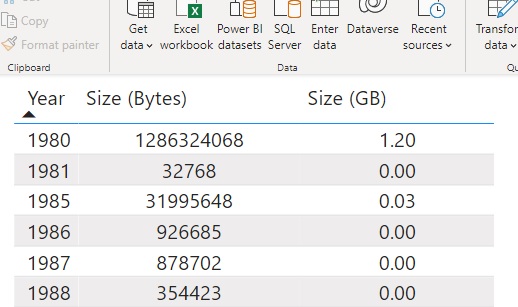
In my existing view I have been able to use the automatically created heirarchy for the date so as to group by year, and also added a column to convert size from bytes to GB as shown in the first screen shot.
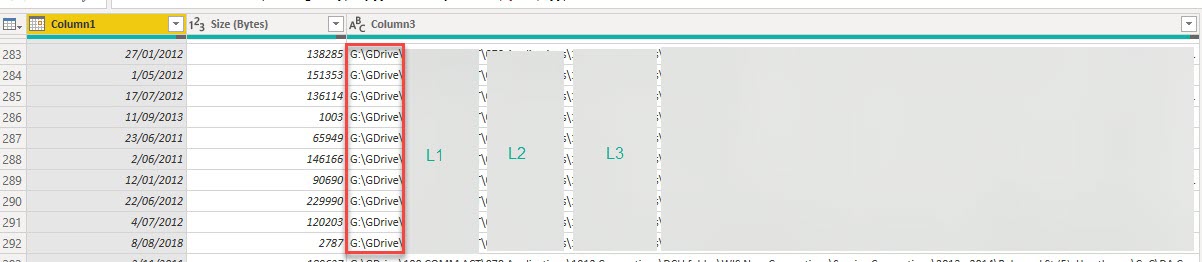
For the new view I would like to have a drill down section which focuses and group the files based on the directory level as shown in the image from L1 down to L3 while ignoring the prefix G:\GDrive\ bounded in the Red box. The resulting view would then show 2 columns
Directory | Size (GB)
and these columns should then replicate as the user drills down.
I'm sure it's not exactly difficult as I know exactly how I'd do this in Excel with a pivot table. I'm just clueless on how to convert this to a PowerBI query.
Thank you.
' cx='32' cy='32' r='32' /%3E%3Ctext x='50%25' y='55%25' dominant-baseline='middle' text-anchor='middle' fill='%23FFF' %3EA%3C/text%3E%3C/svg%3E)
Power Bi is not currently supported here on Q&A. The product group for Power Bi actively monitors questions over at
https://community.powerbi.com/
--please don't forget to upvote and  if the reply is helpful--